Haverstraw: Fire Incidents, New York (NY)
Where are fire incidents reported in Haverstraw, NY
Something went wrong! Please refresh the page.
|
| |||||||||||||||||||||||||||||||||||||||||||||||||||||||||||||||||||||||||||||||||||||||||||||||||||||||||||||
2003 - 2018 National Fire Incident Reporting System (NFIRS) incidents
- Incident types reported to NFIRS in Haverstraw, NY
- 46434.6%Hazardous Condition
- 35326.3%Fire
- 23517.5%False Alarm
- 1208.9%Service Call
- 1138.4%Good Intent Call
- 473.5%Rescue & EMS
- 50.4%Severe Weather
- 30.2%Overpressure Rupture
- Fire incident types reported to NFIRS in Haverstraw, NY
- 23165.4%Structure Fires
- 8122.9%Outside Fires
- 277.6%Mobile Property/Vehicle Fires
- 144.0%Other
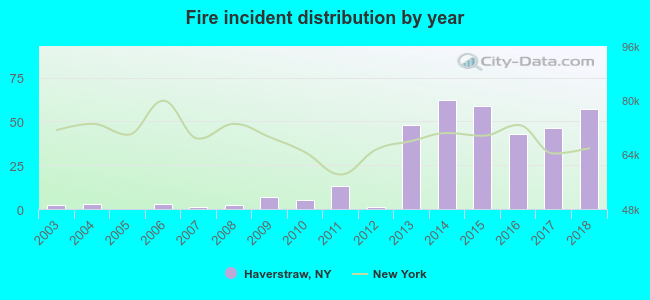 According to the data from the years 2003 - 2018 the average number of fire incidents per year is 22. The highest number of fire incidents - 62 took place in 2014, and the least - 0 in 2005. The data has a growing trend.
The average number of yearly fire incidents per 10k residents in Haverstraw, NY compared to nearest cities:
(Note: Based on data for the last 3 years, including only cities with population 5,000 and above)
| Haverstraw: | 40.0 |
| West Haverstraw: | 7.4 |
| Thiells: | 4.0 |
| Stony Point: | 17.0 |
| Mount Ivy: | 1.5 |
| Congers: | 31.1 |
| New City: | 19.5 |
| New Square: | 16.5 |
| New Hempstead: | 30.8 |
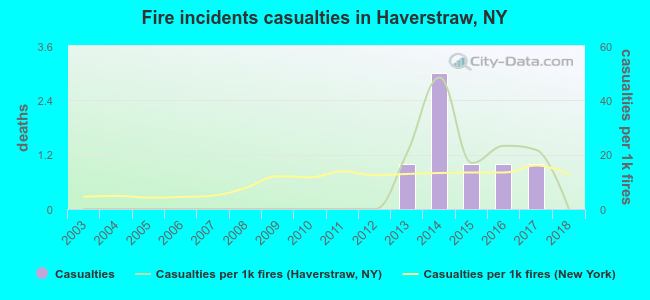 According to the reports from the years 2003 - 2018 the average number of fire-related yearly casualties is 0. The highest number of reported casualties - 3 took place in 2014, and the lowest - 0 in 2003. The data has a constant trend.
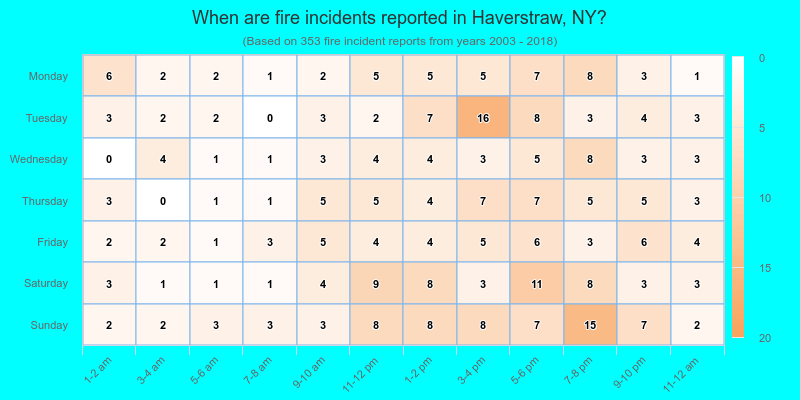
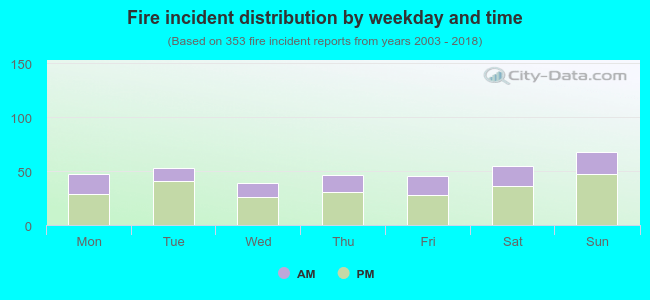 32.6% incidents where reported in the morning and 67.4% in the evening. The most fires (19.3%) took place on Sunday, and the least (11.0%) on Wednesday.
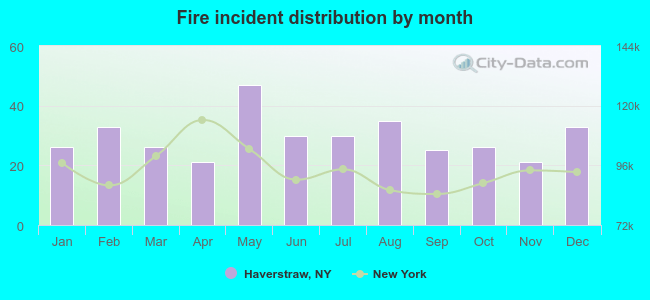 Based on the 353 fire incidents from years 2003 - 2018 most fires (13.3%) took place during May, and the least (5.9%) in April.
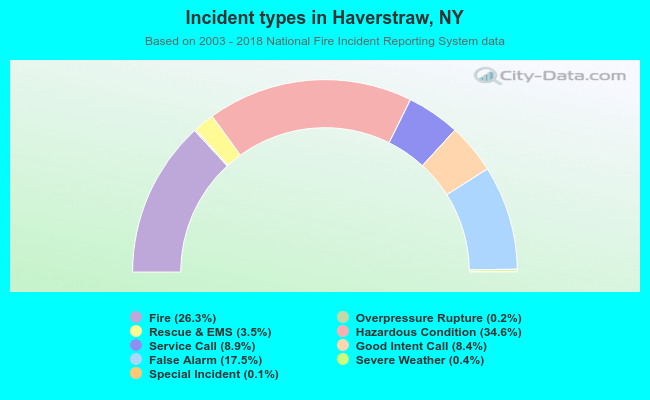 Out of all 1,341 cases reported during the years 2003 - 2018, the most belonged to the categories: Hazardous Condition (34.6%), Fire (26.3%), and False Alarm (17.5%).
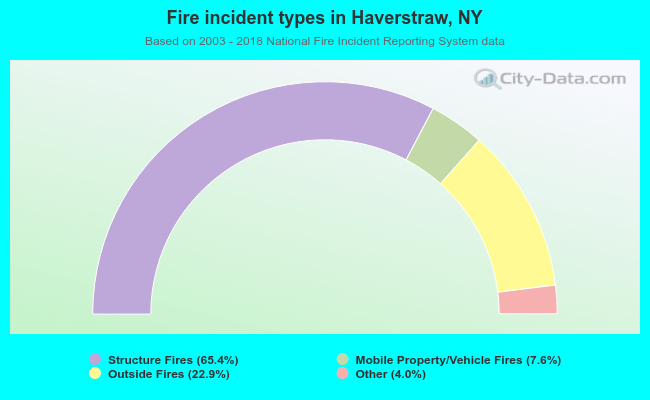 When looking into fire subcategories, the most reports belonged to: Structure Fires (65.4%), and Outside Fires (22.9%).