Valley Cottage: Fire Incidents, New York (NY)
Where are fire incidents reported in Valley Cottage, NY
Something went wrong! Please refresh the page.
|
| |||||||||||||||||||||||||||||||||||||||||||||||||||||||||||||||||||||||||||||||||||||||||||||||||||||||||||||
2002 - 2018 National Fire Incident Reporting System (NFIRS) incidents
- Incident types reported to NFIRS in Valley Cottage, NY
- 55232.1%Hazardous Condition
- 44826.0%Fire
- 36621.3%False Alarm
- 20411.8%Good Intent Call
- 1066.2%Service Call
- 261.5%Rescue & EMS
- 150.9%Severe Weather
- 30.2%Overpressure Rupture
- 20.1%Special Incident
- Fire incident types reported to NFIRS in Valley Cottage, NY
- 25757.4%Structure Fires
- 12227.2%Outside Fires
- 439.6%Mobile Property/Vehicle Fires
- 265.8%Other
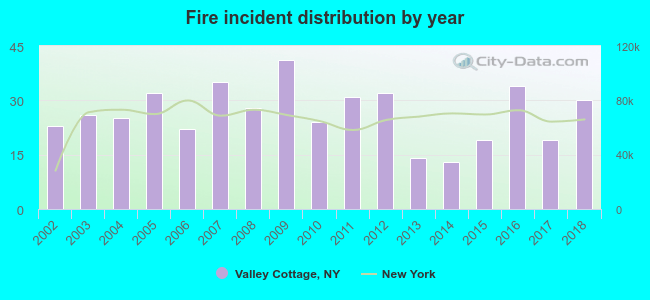 According to the data from the years 2002 - 2018 the average number of fires per year is 26. The highest number of fire incidents - 41 took place in 2009, and the least - 13 in 2014. The data has an increasing trend.
The average number of yearly fire incidents per 10k residents in Valley Cottage, NY compared to nearest cities:
(Note: Based on data for the last 3 years, including only cities with population 5,000 and above)
| Valley Cottage: | 30.4 |
| Congers: | 31.1 |
| Nyack: | 3.8 |
| New City: | 19.5 |
| Blauvelt: | 24.6 |
| Nanuet: | 24.0 |
| Sleepy Hollow: | 3.3 |
| New Square: | 16.5 |
| Hillcrest: | 7.5 |

 30.4% incidents where reported in the morning and 69.6% in the evening. The most fires (19.6%) took place on Sunday, and the least (9.8%) on Tuesday.
 According to the 448 reports from years 2002 - 2018 most fires (11.8%) took place during December, and the least (5.4%) in February.
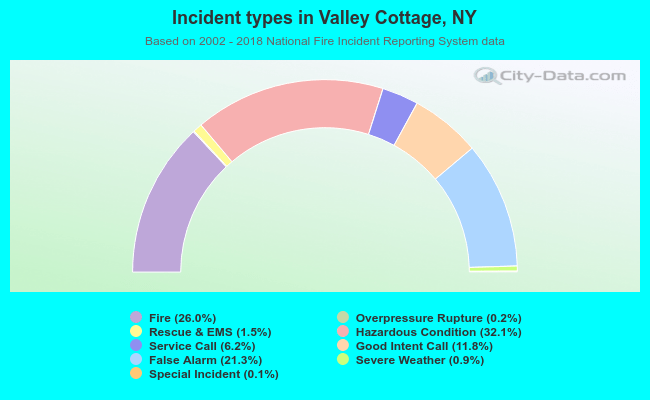 Out of all 1,722 cases reported during the years 2002 - 2018, the most belonged to the categories: Hazardous Condition (32.1%), Fire (26.0%), and False Alarm (21.3%).
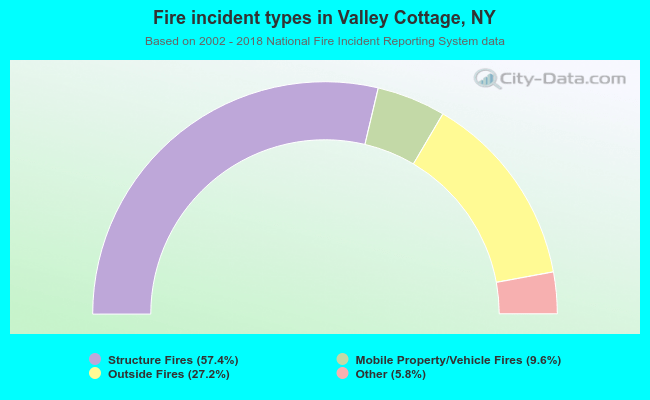 When looking into fire subcategories, the most incidents belonged to: Structure Fires (57.4%), and Outside Fires (27.2%).