Connersville: Fire Incidents, Indiana (IN)
Where are fire incidents reported in Connersville, IN
Something went wrong! Please refresh the page.
| Fire incidents reported | |
|---|---|
| Sreet name | Count |
| WESTERN AVE | 182 |
| 5 TH ST | 136 |
| EASTERN AVE | 106 |
| GRAND AVE | 80 |
| CENTRAL AVE | 76 |
| VIRGINIA AVE | 72 |
| VERMONT AVE | 70 |
| BEECH ST | 64 |
| 12 TH ST | 62 |
| 7 TH ST | 60 |
| 21 ST ST | 54 |
| IOWA AVE | 48 |
| PARK RD | 48 |
| OHIO AVE | 46 |
| VINE ST | 46 |
| 3 RD ST | 42 |
| 8 TH ST | 40 |
| INDIANA AVE | 40 |
| 10 TH ST | 32 |
| 11 TH ST | 32 |
| 30 TH ST | 32 |
| 6 TH ST | 32 |
| COUNTRY CLUB RD | 32 |
| EVERTON RD | 32 |
| SUMMIT AVE | 32 |
| FOUNTAIN ST | 30 |
| 35 TH ST | 28 |
| COUNTY ROAD 350 RD | 28 |
| REID ST | 28 |
| WAYNE AVE | 28 |
| Other | 390 |
2002 - 2018 National Fire Incident Reporting System (NFIRS) incidents
- Incident types reported to NFIRS in Connersville, IN
- 3,90447.4%Rescue & EMS
- 2,02824.6%Fire
- 1,49118.1%Hazardous Condition
- 2983.6%Good Intent Call
- 2362.9%False Alarm
- 1882.3%Service Call
- 570.7%Special Incident
- 180.2%Severe Weather
- 140.2%Overpressure Rupture
- Fire incident types reported to NFIRS in Connersville, IN
- 90844.8%Outside Fires
- 73936.4%Structure Fires
- 23411.5%Mobile Property/Vehicle Fires
- 1477.2%Other
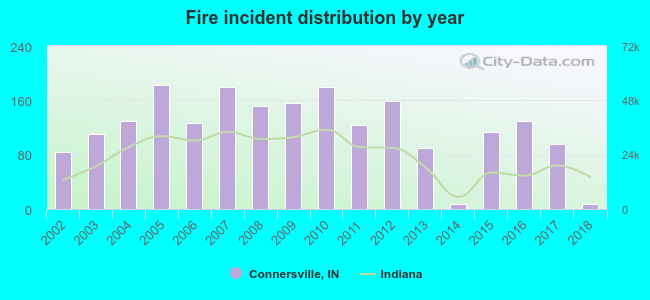 According to the data from the years 2002 - 2018 the average number of fires per year is 119. The highest number of fires - 182 took place in 2005, and the least - 8 in 2014. The data has a declining trend.
The average number of yearly fire incidents per 10k residents in Connersville, IN compared to nearest cities:
(Note: Based on data for the last 3 years, including only cities with population 5,000 and above)
| Connersville: | 59.9 |
| Rushville: | 30.3 |
| Richmond: | 3.6 |
| New Castle: | 30.4 |
| Batesville: | 22.4 |
| Greensburg: | 53.0 |
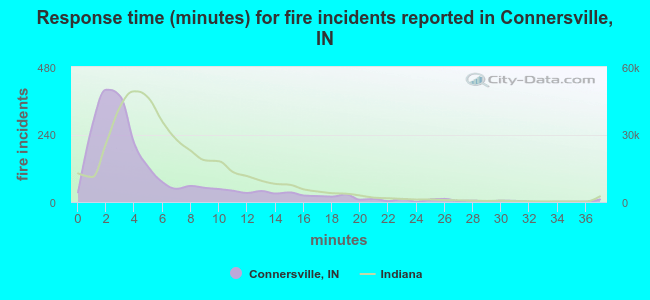 The median response time based on all reported fire incidents is 3 minutes. This is much lower compared to the Indiana median value.
The median response time in Connersville, IN compared to nearest cities:
(Note: Based on data for all years, including only cities with at least 500 fire incidents)
| Connersville: | 3 minutes |
| Centerville: | 7 minutes |
| Rushville: | 5 minutes |
| Richmond: | 4 minutes |
| New Castle: | 3 minutes |
| Greensburg: | 6 minutes |
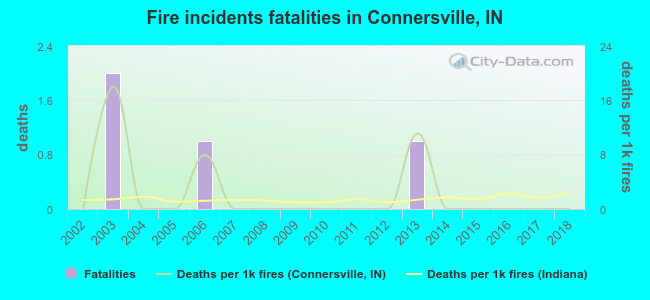 Based on the data from the years 2002 - 2018 the average number of fire-related yearly deaths is 0. The highest number of deaths - 2 took place in 2003, and the lowest - 0 in 2002. The data has a constant trend.
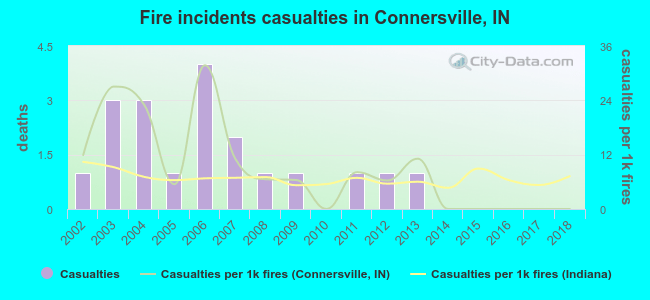 Based on the data from the years 2002 - 2018 the average number of fire-related yearly casualties is 1. The highest number of reported injuries - 4 took place in 2006, and the lowest - 0 in 2010. The data has a declining trend.
The average number of injuries per 1,000 fires is 9. This indicator was the highest - 32 in 2006, and the lowest 0 in 2010. The trend for casualties per 1,000 incidents is decreasing. Compared to the Indiana value the number of casualties per 1,000 incidents is higher.
Based on the data from the years 2002 - 2018 the average number of fire-related yearly casualties is 1. The highest number of reported injuries - 4 took place in 2006, and the lowest - 0 in 2010. The data has a declining trend.
The average number of injuries per 1,000 fires is 9. This indicator was the highest - 32 in 2006, and the lowest 0 in 2010. The trend for casualties per 1,000 incidents is decreasing. Compared to the Indiana value the number of casualties per 1,000 incidents is higher.Casualties per 1,000 incidents in Connersville, IN compared to nearest cities:
(Note: Based on data for all years, including only cities with at least 500 fire incidents)
| Connersville: | 9.4 |
| Centerville: | 5.1 |
| Rushville: | 4.1 |
| Richmond: | 12.1 |
| New Castle: | 9.5 |
| Greensburg: | 5.6 |
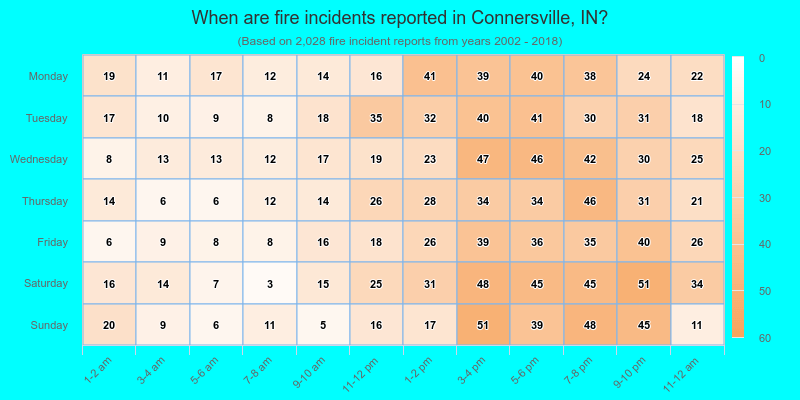
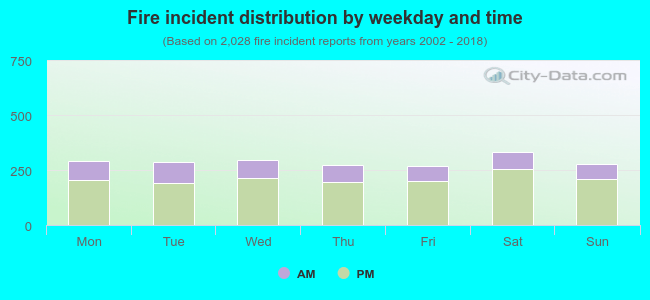 27.5% incidents where reported in the morning and 72.5% in the evening. The most fires (16.5%) took place on Saturday, and the least (13.2%) on Friday.
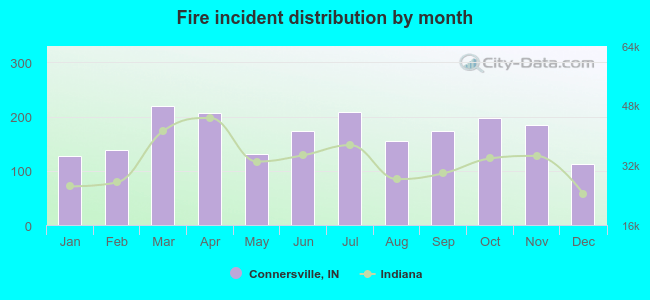 Based on the 2,028 incident reports from years 2002 - 2018 most fires (10.8%) took place during March, and the least (5.5%) in December.
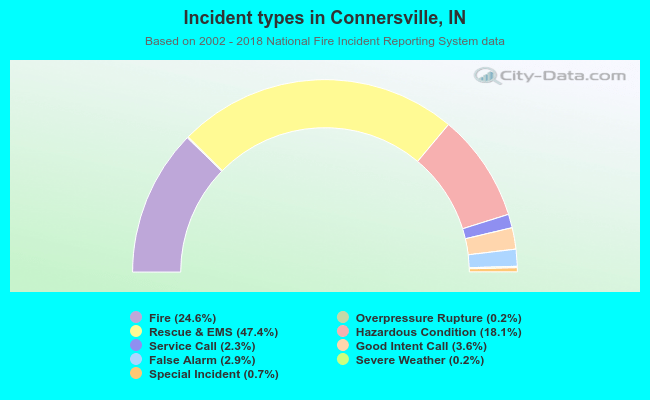 Out of all 8,234 cases reported during the years 2002 - 2018, the most belonged to the categories: Rescue & EMS (47.4%), Fire (24.6%), and Hazardous Condition (18.1%).
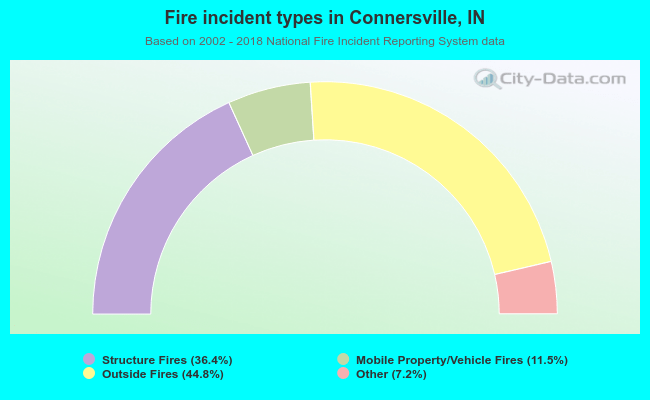 When looking into fire subcategories, the most reports belonged to: Outside Fires (44.8%), and Structure Fires (36.4%).