Richmond: Fire Incidents, Indiana (IN)
Where are fire incidents reported in Richmond, IN
Something went wrong! Please refresh the page.
| Fire incidents reported | |
|---|---|
| Sreet name | Count |
| MAIN ST | 336 |
| 13TH ST | 186 |
| NATIONAL RD | 186 |
| 14TH ST | 182 |
| 5TH ST | 172 |
| US 27 | 150 |
| 11TH ST | 148 |
| 12TH ST | 138 |
| 7TH ST | 122 |
| 8TH ST | 114 |
| CHESTER BLVD | 114 |
| 9TH ST | 110 |
| 16TH ST | 104 |
| 15TH ST | 102 |
| A ST | 102 |
| 10TH ST | 100 |
| 18TH ST | 90 |
| E ST | 88 |
| 4TH ST | 78 |
| 17TH ST | 76 |
| J ST | 70 |
| 19TH ST | 56 |
| C ST | 52 |
| D ST | 46 |
| L ST | 46 |
| SHERIDAN ST | 42 |
| SR 227 | 42 |
| 20TH ST | 40 |
| B ST | 40 |
| 22ND ST | 38 |
2002 - 2016 National Fire Incident Reporting System (NFIRS) incidents
- Incident types reported to NFIRS in Richmond, IN
- 6,98449.2%Rescue & EMS
- 3,13822.1%Fire
- 2,30716.3%Hazardous Condition
- 5924.2%False Alarm
- 5624.0%Service Call
- 5413.8%Good Intent Call
- 480.3%Overpressure Rupture
- Fire incident types reported to NFIRS in Richmond, IN
- 1,32442.2%Structure Fires
- 1,15136.7%Outside Fires
- 49315.7%Mobile Property/Vehicle Fires
- 1705.4%Other
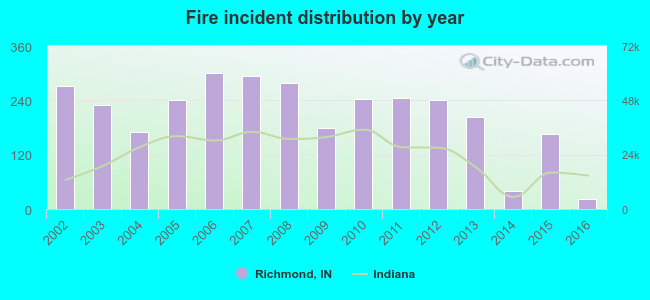 According to the data from the years 2002 - 2016 the average number of fires per year is 208. The highest number of fire incidents - 301 took place in 2006, and the least - 22 in 2016. The data has a dropping trend.
The average number of yearly fire incidents per 10k residents in Richmond, IN compared to nearest cities:
(Note: Based on data for the last 3 years, including only cities with population 5,000 and above)
| Richmond: | 3.6 |
| Connersville: | 59.9 |
| New Castle: | 30.4 |
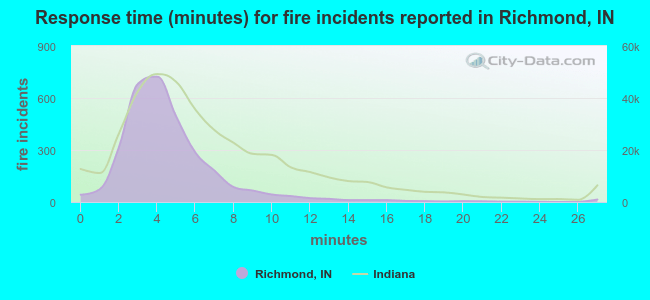 The median response time based on all reported fire incidents is 4 minutes. This is lower than the Indiana median value.
The median response time in Richmond, IN compared to nearest cities:
(Note: Based on data for all years, including only cities with at least 500 fire incidents)
| Richmond: | 4 minutes |
| Centerville: | 7 minutes |
| Connersville: | 3 minutes |
| Winchester: | 4 minutes |
| New Castle: | 3 minutes |
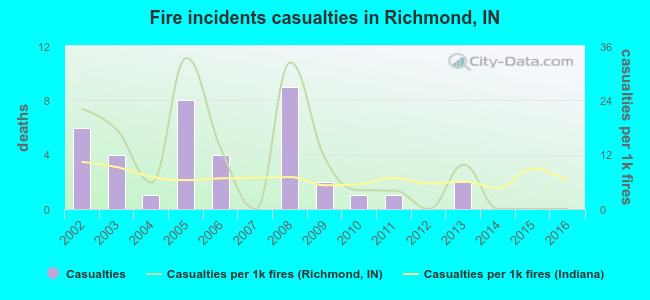 Based on the data from the years 2002 - 2016 the average number of fire-related casualties per year is 3. The highest number of reported casualties - 9 took place in 2008, and the lowest - 0 in 2007. The data has a declining trend.
The average number of casualties per 1,000 fires is 10. This indicator was the highest - 33 in 2005, and the lowest 0 in 2007. The trend for injuries per 1,000 fires is declining. Compared to the state value the number of casualties per 1,000 fires is higher.
Based on the data from the years 2002 - 2016 the average number of fire-related casualties per year is 3. The highest number of reported casualties - 9 took place in 2008, and the lowest - 0 in 2007. The data has a declining trend.
The average number of casualties per 1,000 fires is 10. This indicator was the highest - 33 in 2005, and the lowest 0 in 2007. The trend for injuries per 1,000 fires is declining. Compared to the state value the number of casualties per 1,000 fires is higher.Casualties per 1,000 incidents in Richmond, IN compared to nearest cities:
(Note: Based on data for all years, including only cities with at least 500 fire incidents)
| Richmond: | 12.1 |
| Centerville: | 5.1 |
| Connersville: | 9.4 |
| Winchester: | 12.3 |
| New Castle: | 9.5 |
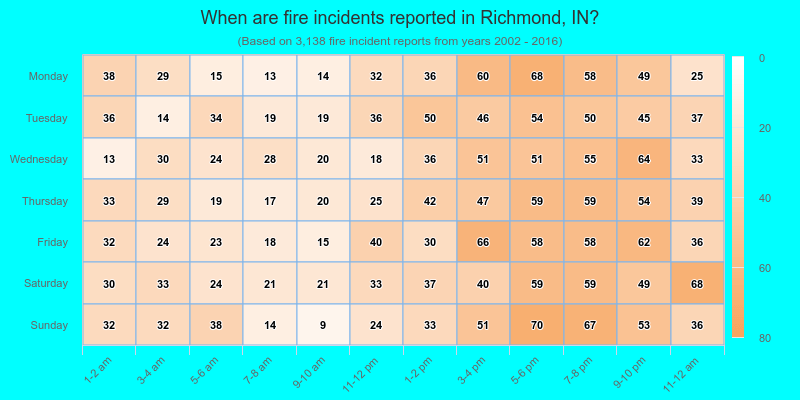
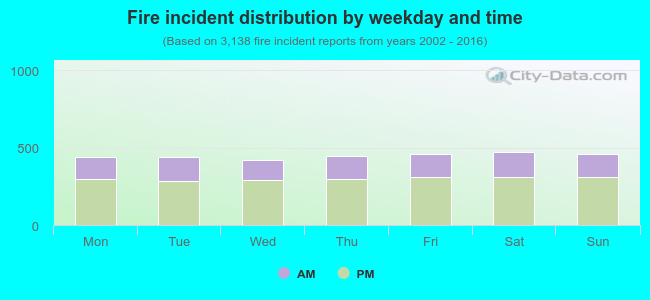 33.1% incidents where reported in the morning and 66.9% in the evening. The most fires (15.1%) took place on Saturday, and the least (13.5%) on Wednesday.
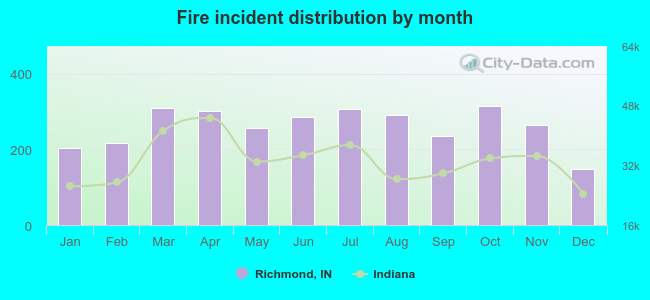 Based on the 3,138 reports from years 2002 - 2016 most fires (10.1%) took place during October, and the least (4.7%) in December.
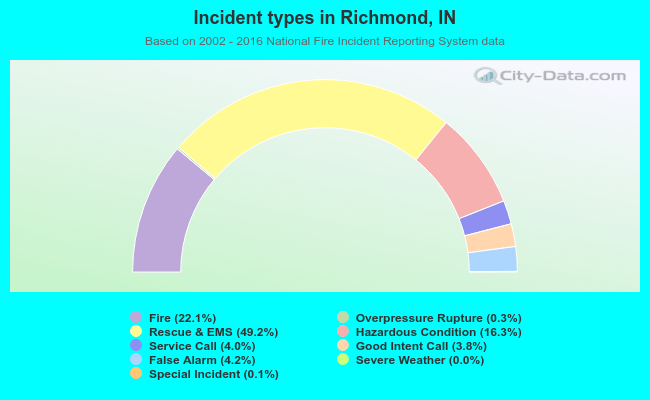 Out of all 14,182 cases reported during the years 2002 - 2016, the most belonged to the categories: Rescue & EMS (49.2%), Fire (22.1%), and Hazardous Condition (16.3%).
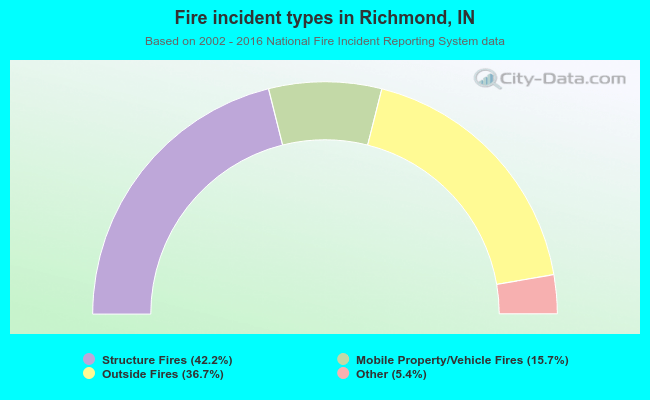 When looking into fire subcategories, the most incidents belonged to: Structure Fires (42.2%), and Outside Fires (36.7%).