Conroe: Fire Incidents, Texas (TX)
Where are fire incidents reported in Conroe, TX
Something went wrong! Please refresh the page.
| Fire incidents reported | |
|---|---|
| Sreet name | Count |
| INTERSTATE 45 | 620 |
| LOOP 336 | 374 |
| FRAZIER | 276 |
| DAVIS | 242 |
| FRAZIER ST | 172 |
| HWY 105 | 154 |
| HWY 105 E | 146 |
| SH 242 | 146 |
| FM 3083 | 126 |
| FM 1484 | 120 |
| LONGMIRE RD | 100 |
| FM 1485 | 98 |
| PLANTATION DR | 96 |
| CROCKETT MARTIN RD | 92 |
| HIGHWAY 105 | 86 |
| NOT LISTED SEE NOTES | 84 |
| I-45 | 82 |
| FM 1488 | 78 |
| BERT BROWN RD | 72 |
| I-45 FWY | 72 |
| OLD HIGHWAY 105 | 70 |
| DAVIS ST | 66 |
| FM 1314 | 66 |
| MONTGOMERY PARK BLVD | 66 |
| GLADSTELL | 62 |
| LEAGUE LINE RD | 62 |
| MAIN ST | 60 |
| OUT OF DISTRICT | 60 |
| SLEEPY HOLLOW RD | 60 |
| CREIGHTON RD | 58 |
| Other | 4,490 |
2002 - 2018 National Fire Incident Reporting System (NFIRS) incidents
- Incident types reported to NFIRS in Conroe, TX
- 45,29756.9%Rescue & EMS
- 16,51220.7%Good Intent Call
- 8,35610.5%Fire
- 4,2175.3%Hazardous Condition
- 2,8333.6%False Alarm
- 2,1622.7%Service Call
- 1440.2%Overpressure Rupture
- Fire incident types reported to NFIRS in Conroe, TX
- 4,02448.2%Outside Fires
- 2,78233.3%Structure Fires
- 1,23414.8%Mobile Property/Vehicle Fires
- 3163.8%Other
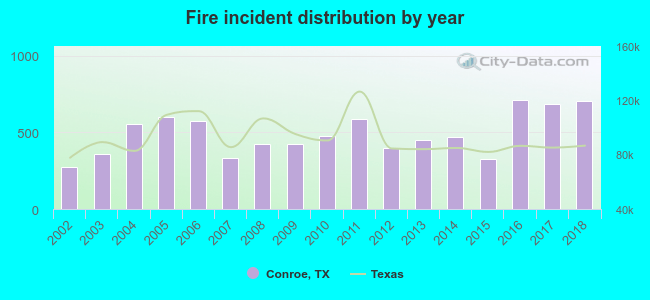 Based on the data from the years 2002 - 2018 the average number of fire incidents per year is 492. The highest number of reported fires - 710 took place in 2016, and the least - 273 in 2002. The data has an increasing trend.
The average number of yearly fire incidents per 10k residents in Conroe, TX compared to nearest cities:
(Note: Based on data for the last 3 years, including only cities with population 5,000 and above)
| Conroe: | 106.3 |
| Willis: | 247.0 |
| The Woodlands: | 14.3 |
| Tomball: | 209.2 |
| Spring: | 113.9 |
| Cleveland: | 466.1 |
| Humble: | 217.5 |
| Atascocita: | 1.4 |
| Huntsville: | 57.7 |
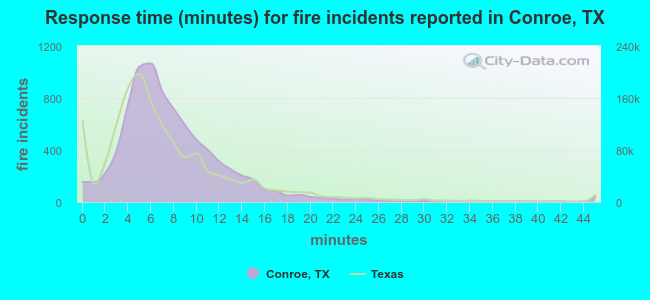 The median response time based on all reported fire incidents is 7 minutes. This is comparable to the state median value.
The median response time in Conroe, TX compared to nearest cities:
(Note: Based on data for all years, including only cities with at least 500 fire incidents)
| Conroe: | 7 minutes |
| Willis: | 9 minutes |
| The Woodlands: | 6 minutes |
| Montgomery: | 8 minutes |
| New Waverly: | 9 minutes |
| Tomball: | 8 minutes |
| Spring: | 7 minutes |
| Splendora: | 10 minutes |
| Magnolia: | 9 minutes |
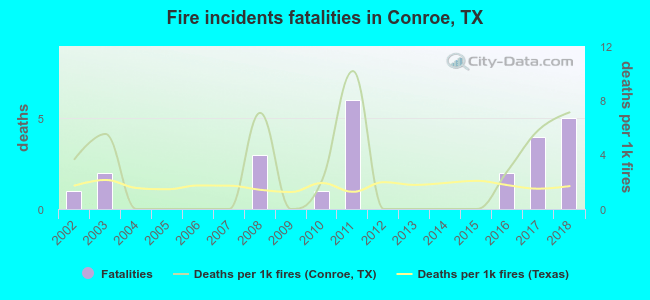 Based on the data from the years 2002 - 2018 the average number of fire-related fatalities per year is 1. The highest number of reported deaths - 6 took place in 2011, and the lowest - 0 in 2004. The data has an increasing trend.
The average number of deaths per 1,000 fires is 3. This indicator was the highest - 10 in 2011, and the lowest 0 in 2004. The trend for deaths per 1,000 incidents is increasing. Compared to the Texas value the number of fatalities per 1,000 incidents is higher.
Based on the data from the years 2002 - 2018 the average number of fire-related fatalities per year is 1. The highest number of reported deaths - 6 took place in 2011, and the lowest - 0 in 2004. The data has an increasing trend.
The average number of deaths per 1,000 fires is 3. This indicator was the highest - 10 in 2011, and the lowest 0 in 2004. The trend for deaths per 1,000 incidents is increasing. Compared to the Texas value the number of fatalities per 1,000 incidents is higher.Deaths per 1,000 incidents in Conroe, TX compared to nearest cities:
(Note: Based on data for all years, including only cities with at least 2,500 fire incidents)
| Conroe: | 2.9 |
| Willis: | 1.6 |
| The Woodlands: | 1.1 |
| Montgomery: | 1.5 |
| Tomball: | 3.3 |
| Spring: | 1.4 |
| Magnolia: | 1.4 |
| Cleveland: | 0.9 |
| Humble: | 2.0 |
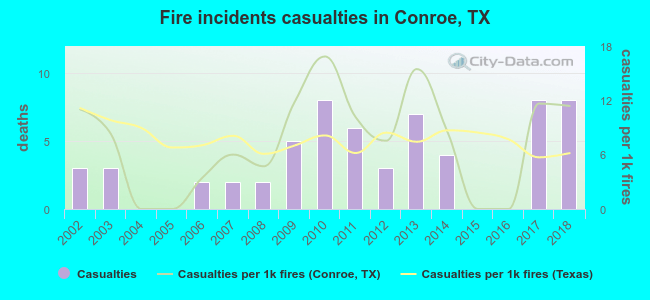 According to the reports from the years 2002 - 2018 the average number of fire-related casualties per year is 4. The highest number of injuries - 8 took place in 2010, and the lowest - 0 in 2004. The data has a rising trend.
The average number of casualties per 1,000 fire incidents is 7. This indicator was the highest - 17 in 2010, and the lowest 0 in 2004. The trend for casualties per 1,000 fires is increasing. Compared to the Texas value the number of injuries per 1,000 fire incidents is about the same.
According to the reports from the years 2002 - 2018 the average number of fire-related casualties per year is 4. The highest number of injuries - 8 took place in 2010, and the lowest - 0 in 2004. The data has a rising trend.
The average number of casualties per 1,000 fire incidents is 7. This indicator was the highest - 17 in 2010, and the lowest 0 in 2004. The trend for casualties per 1,000 fires is increasing. Compared to the Texas value the number of injuries per 1,000 fire incidents is about the same.Casualties per 1,000 incidents in Conroe, TX compared to nearest cities:
(Note: Based on data for all years, including only cities with at least 500 fire incidents)
| Conroe: | 7.3 |
| Willis: | 9.8 |
| The Woodlands: | 19.6 |
| Montgomery: | 7.5 |
| New Waverly: | 1.1 |
| Tomball: | 15.8 |
| Spring: | 11.9 |
| Splendora: | 3.1 |
| Magnolia: | 4.3 |
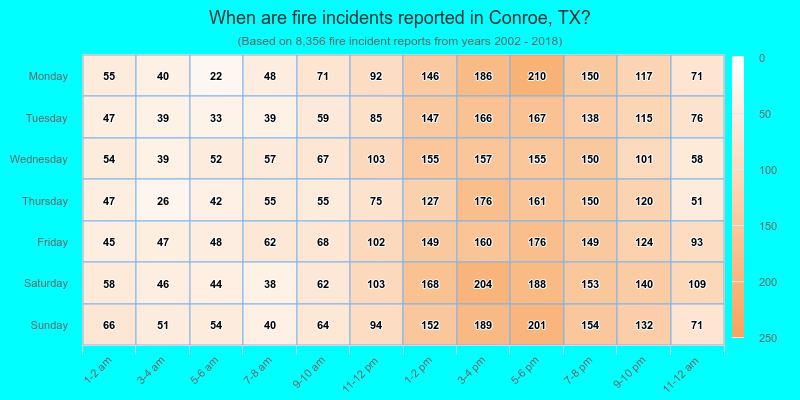
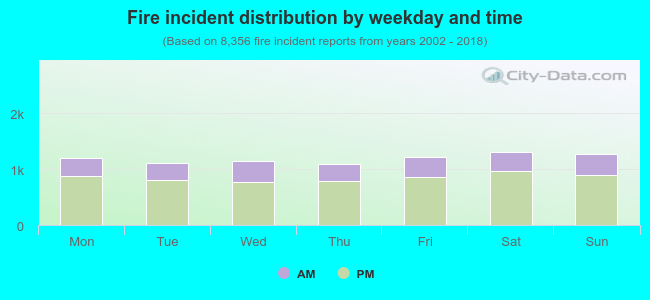 28.7% incidents where reported in the morning and 71.3% in the evening. The most fires (15.7%) took place on Saturday, and the least (13.0%) on Thursday.
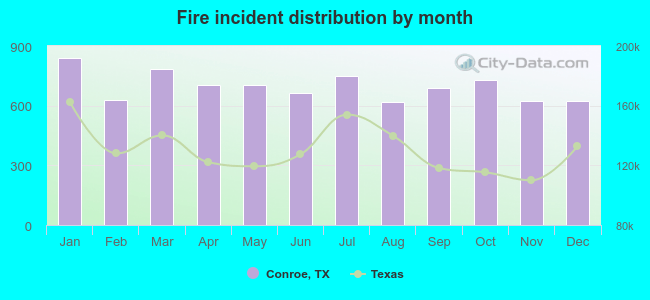 According to the 8,356 fires from years 2002 - 2018 most fires (10.1%) took place during January, and the least (7.4%) in August.
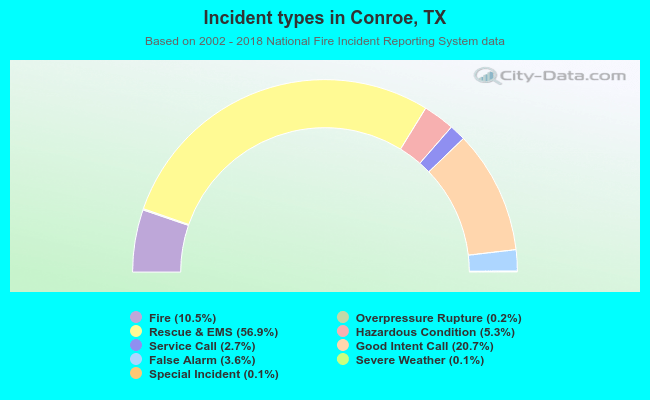 Out of all 79,623 cases reported during the years 2002 - 2018, the most belonged to the categories: Rescue & EMS (56.9%), Good Intent Call (20.7%), and Fire (10.5%).
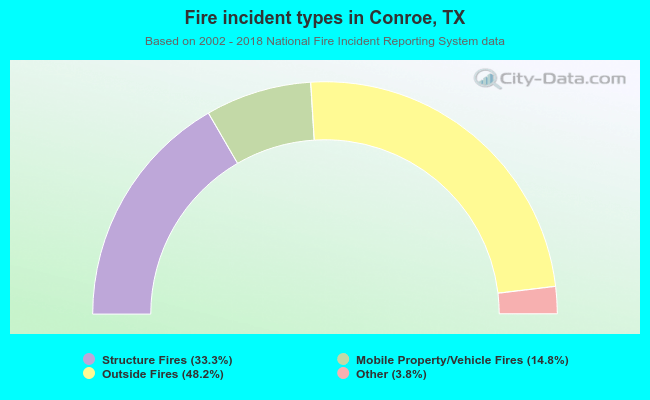 When looking into fire subcategories, the most incidents belonged to: Outside Fires (48.2%), and Structure Fires (33.3%).