Willis: Fire Incidents, Texas (TX)
Where are fire incidents reported in Willis, TX
Something went wrong! Please refresh the page.
| Fire incidents reported | |
|---|---|
| Sreet name | Count |
| INTERSTATE 45 | 348 |
| FM 1097 | 238 |
| HIGHWAY 75 | 166 |
| CALVARY RD | 106 |
| FM 830 | 102 |
| FM 2432 | 98 |
| COUNTY LINE RD | 82 |
| LONGSTREET RD | 76 |
| ROGERS RD | 72 |
| COALTOWN RD | 62 |
| FM 1484 | 40 |
| MEADOR RD | 40 |
| HILLTOP DR | 38 |
| MONTGOMERY ST | 38 |
| SHEPARD HILL RD | 38 |
| CANAL | 36 |
| AFRICAN HILL RD | 34 |
| DANVILLE ST | 32 |
| PADDOCK ST | 30 |
| WILLIAMS RD | 30 |
| AMBLEWOOD | 28 |
| OLD MONTGOMERY RD | 28 |
| POWELL ST | 28 |
| ROSE RD | 26 |
| THOMPSON RD | 26 |
| CUDE CEMETARY RD | 24 |
| CUDE CEMETERY RD | 24 |
| FARRELL RD | 24 |
| LEESHORE DR | 24 |
| FM 3081 | 22 |
| Other | 588 |
2002 - 2018 National Fire Incident Reporting System (NFIRS) incidents
- Incident types reported to NFIRS in Willis, TX
- 10,77655.2%Rescue & EMS
- 4,07720.9%Good Intent Call
- 2,54813.1%Fire
- 9805.0%Hazardous Condition
- 8314.3%Service Call
- 2611.3%False Alarm
- 200.1%Overpressure Rupture
- Fire incident types reported to NFIRS in Willis, TX
- 1,40555.1%Outside Fires
- 74729.3%Structure Fires
- 35513.9%Mobile Property/Vehicle Fires
- 411.6%Other
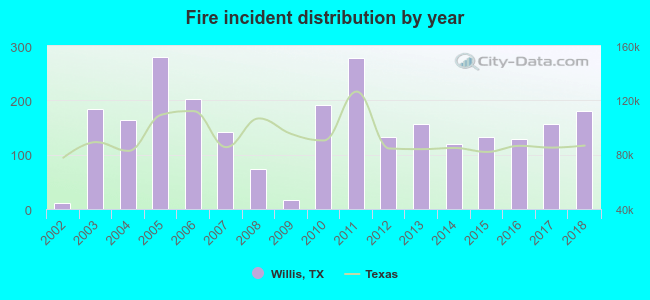 Based on the data from the years 2002 - 2018 the average number of fires per year is 150. The highest number of reported fires - 280 took place in 2005, and the least - 11 in 2002. The data has a growing trend.
The average number of yearly fire incidents per 10k residents in Willis, TX compared to nearest cities:
(Note: Based on data for the last 3 years, including only cities with population 5,000 and above)
| Willis: | 247.0 |
| Conroe: | 106.3 |
| The Woodlands: | 14.3 |
| Huntsville: | 57.7 |
| Tomball: | 209.2 |
| Cleveland: | 466.1 |
| Spring: | 113.9 |
| Humble: | 217.5 |
| Atascocita: | 1.4 |
 The median response time based on all reported fire incidents is 9 minutes. This is higher compared to the state median value.
The median response time in Willis, TX compared to nearest cities:
(Note: Based on data for all years, including only cities with at least 500 fire incidents)
| Willis: | 9 minutes |
| Conroe: | 7 minutes |
| New Waverly: | 9 minutes |
| Montgomery: | 8 minutes |
| The Woodlands: | 6 minutes |
| Huntsville: | 10 minutes |
| Magnolia: | 9 minutes |
| Splendora: | 10 minutes |
| Coldspring: | 12 minutes |
 Based on the reports from the years 2002 - 2018 the average number of fire-related yearly deaths is 0. The highest number of deaths - 1 took place in 2010, and the lowest - 0 in 2002. The data has an increasing trend.
The average number of fatalities per 1,000 fire incidents is 2. This indicator was the highest - 8 in 2014, and the lowest 0 in 2002. The trend for fatalities per 1,000 fires is growing. Compared to the Texas value the number of fatalities per 1,000 incidents is about the same.
Based on the reports from the years 2002 - 2018 the average number of fire-related yearly deaths is 0. The highest number of deaths - 1 took place in 2010, and the lowest - 0 in 2002. The data has an increasing trend.
The average number of fatalities per 1,000 fire incidents is 2. This indicator was the highest - 8 in 2014, and the lowest 0 in 2002. The trend for fatalities per 1,000 fires is growing. Compared to the Texas value the number of fatalities per 1,000 incidents is about the same.Deaths per 1,000 incidents in Willis, TX compared to nearest cities:
(Note: Based on data for all years, including only cities with at least 2,500 fire incidents)
| Willis: | 1.6 |
| Conroe: | 2.9 |
| Montgomery: | 1.5 |
| The Woodlands: | 1.1 |
| Huntsville: | 0.8 |
| Magnolia: | 1.4 |
| Tomball: | 3.3 |
| Cleveland: | 0.9 |
| Spring: | 1.4 |
 Based on the data from the years 2002 - 2018 the average number of fire-related yearly casualties is 1. The highest number of injuries - 6 took place in 2017, and the lowest - 0 in 2002. The data has an increasing trend.
The average number of injuries per 1,000 fires is 9. This indicator was the highest - 38 in 2017, and the lowest 0 in 2002. The trend for injuries per 1,000 fires is rising. Compared to the Texas value the number of casualties per 1,000 incidents is higher.
Based on the data from the years 2002 - 2018 the average number of fire-related yearly casualties is 1. The highest number of injuries - 6 took place in 2017, and the lowest - 0 in 2002. The data has an increasing trend.
The average number of injuries per 1,000 fires is 9. This indicator was the highest - 38 in 2017, and the lowest 0 in 2002. The trend for injuries per 1,000 fires is rising. Compared to the Texas value the number of casualties per 1,000 incidents is higher.Casualties per 1,000 incidents in Willis, TX compared to nearest cities:
(Note: Based on data for all years, including only cities with at least 500 fire incidents)
| Willis: | 9.8 |
| Conroe: | 7.3 |
| New Waverly: | 1.1 |
| Montgomery: | 7.5 |
| The Woodlands: | 19.6 |
| Huntsville: | 3.0 |
| Magnolia: | 4.3 |
| Splendora: | 3.1 |
| Coldspring: | 1.5 |
 28.2% incidents where reported in the morning and 71.8% in the evening. The most fires (16.4%) took place on Saturday, and the least (12.5%) on Tuesday.
 Based on the 2,548 incident reports from years 2002 - 2018 most fires (10.8%) took place during September, and the least (5.5%) in February.
 Out of all 19,508 cases reported during the years 2002 - 2018, the most belonged to the categories: Rescue & EMS (55.2%), Good Intent Call (20.9%), and Fire (13.1%).
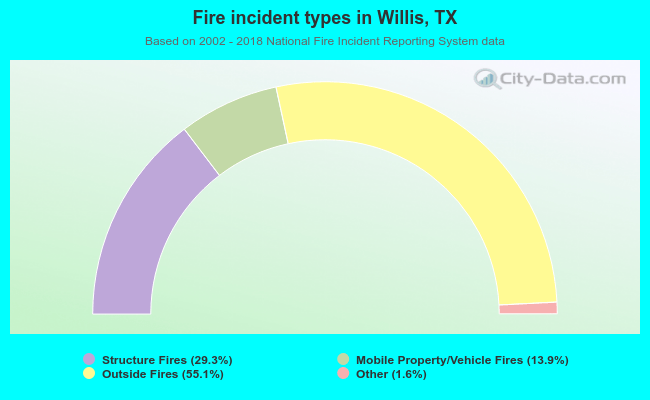 When looking into fire subcategories, the most reports belonged to: Outside Fires (55.1%), and Structure Fires (29.3%).