Cushing: Fire Incidents, Oklahoma (OK)
Where are fire incidents reported in Cushing, OK
Something went wrong! Please refresh the page.
|
| |||||||||||||||||||||||||||||||||||||||||||||||||||||||||||||||||||||||||||||||||||||||||||||||||||||||||||||
| Other | 159 | |||||||||||||||||||||||||||||||||||||||||||||||||||||||||||||||||||||||||||||||||||||||||||||||||||||||||||||
2002 - 2018 National Fire Incident Reporting System (NFIRS) incidents
- Incident types reported to NFIRS in Cushing, OK
- 1,49152.9%Fire
- 53118.8%Hazardous Condition
- 31611.2%Rescue & EMS
- 2398.5%Good Intent Call
- 1655.9%False Alarm
- 592.1%Service Call
- 90.3%Severe Weather
- 80.3%Special Incident
- Fire incident types reported to NFIRS in Cushing, OK
- 91361.2%Outside Fires
- 33622.5%Structure Fires
- 16711.2%Mobile Property/Vehicle Fires
- 755.0%Other
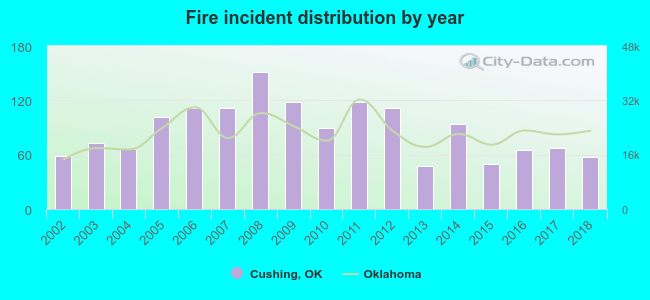 Based on the data from the years 2002 - 2018 the average number of fire incidents per year is 88. The highest number of fires - 151 took place in 2008, and the least - 48 in 2013. The data has a decreasing trend.
The average number of yearly fire incidents per 10k residents in Cushing, OK compared to nearest cities:
(Note: Based on data for the last 3 years, including only cities with population 5,000 and above)
| Cushing: | 80.1 |
| Stillwater: | 18.3 |
| Perry: | 113.0 |
| Sapulpa: | 90.7 |
| Sand Springs: | 130.8 |
| Guthrie: | 219.0 |
| Harrah: | 147.3 |
| Glenpool: | 49.5 |
 The median response time based on all reported fire incidents is 7 minutes. This is comparable to the state median value.
The median response time in Cushing, OK compared to nearest cities:
(Note: Based on data for all years, including only cities with at least 500 fire incidents)
| Cushing: | 7 minutes |
| Drumright: | 7 minutes |
| Perkins: | 6 minutes |
| Stroud: | 10 minutes |
| Stillwater: | 8 minutes |
| Chandler: | 9 minutes |
| Bristow: | 8 minutes |
| Wellston: | 10 minutes |
| Cleveland: | 9 minutes |
 Based on the data from the years 2002 - 2018 the average number of fire-related yearly deaths is 0. The highest number of deaths - 4 took place in 2009, and the lowest - 0 in 2002. The data has a constant trend.
 24.0% incidents where reported in the morning and 76.0% in the evening. The most fires (17.8%) took place on Saturday, and the least (12.0%) on Tuesday.
 According to the 1,491 fires from years 2002 - 2018 most fires (11.2%) took place during March, and the least (5.3%) in May.
 Out of all 2,820 cases reported during the years 2002 - 2018, the most belonged to the categories: Fire (52.9%), Hazardous Condition (18.8%), and Rescue & EMS (11.2%).
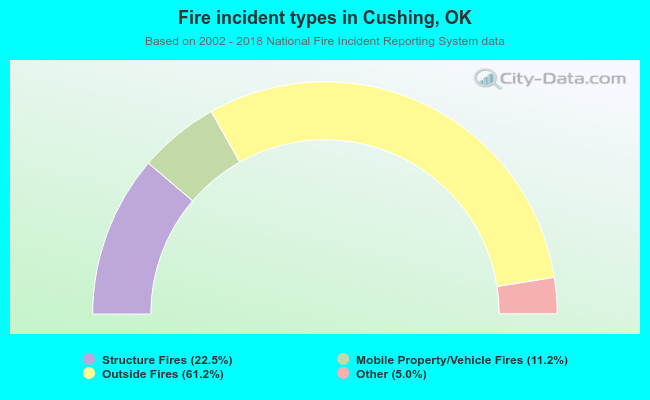 When looking into fire subcategories, the most reports belonged to: Outside Fires (61.2%), and Structure Fires (22.5%).