Sapulpa: Fire Incidents, Oklahoma (OK)
Where are fire incidents reported in Sapulpa, OK
Something went wrong! Please refresh the page.
| Fire incidents reported | |
|---|---|
| Sreet name | Count |
| TURNER TURNPIKE | 210 |
| TAFT AVE | 154 |
| HICKORY ST | 142 |
| MAIN ST | 116 |
| 81ST ST | 110 |
| TEEL RD | 102 |
| DEWEY AVE | 94 |
| HILTON RD | 94 |
| HIGHWAY 97 | 86 |
| 49TH AVE | 82 |
| MISSION ST | 80 |
| 81 ST ST | 74 |
| 49TH W AVE | 68 |
| 71ST ST | 68 |
| FRANKHOMA RD | 66 |
| NEW SAPULPA RD | 64 |
| FRANKOMA RD | 58 |
| JACKSON AVE | 58 |
| LINE ST | 56 |
| SKELLY DR | 54 |
| 91ST ST | 52 |
| SAHOMA LAKE RD | 48 |
| 111TH ST | 46 |
| 71 ST ST | 46 |
| 78TH W AVE | 44 |
| PARK ST | 44 |
| 97 TH AVE | 40 |
| TURNER TPKE | 40 |
| 101ST ST | 38 |
| 161 ST AVE | 38 |
| Other | 1,370 |
2002 - 2018 National Fire Incident Reporting System (NFIRS) incidents
- Incident types reported to NFIRS in Sapulpa, OK
- 7,72844.1%Rescue & EMS
- 3,64220.8%Fire
- 1,83610.5%Service Call
- 1,79510.2%Hazardous Condition
- 1,7089.7%Good Intent Call
- 7464.3%False Alarm
- 380.2%Overpressure Rupture
- 260.1%Special Incident
- Fire incident types reported to NFIRS in Sapulpa, OK
- 1,99054.6%Outside Fires
- 92325.3%Structure Fires
- 52314.4%Mobile Property/Vehicle Fires
- 2065.7%Other
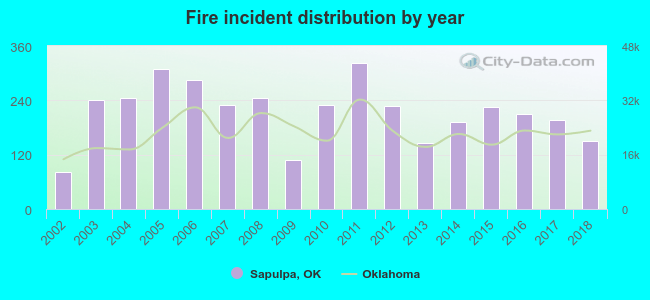 Based on the data from the years 2002 - 2018 the average number of fire incidents per year is 214. The highest number of reported fires - 323 took place in 2011, and the least - 81 in 2002. The data has a rising trend.
The average number of yearly fire incidents per 10k residents in Sapulpa, OK compared to nearest cities:
(Note: Based on data for the last 3 years, including only cities with population 5,000 and above)
| Sapulpa: | 90.7 |
| Glenpool: | 49.5 |
| Jenks: | 35.9 |
| Sand Springs: | 130.8 |
| Tulsa: | 50.9 |
| Bixby: | 20.1 |
| Broken Arrow: | 20.0 |
| Catoosa: | 95.6 |
| Coweta: | 31.5 |
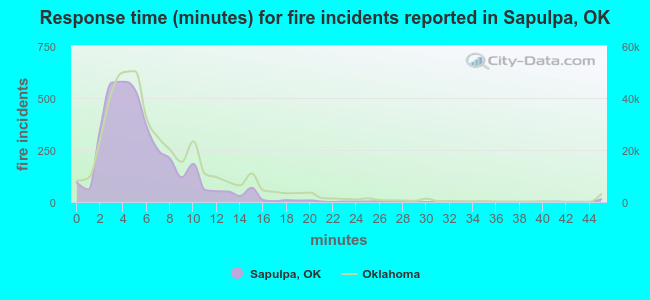 The median response time based on all reported fire incidents is 5 minutes. This is lower than the state median value.
The median response time in Sapulpa, OK compared to nearest cities:
(Note: Based on data for all years, including only cities with at least 500 fire incidents)
| Sapulpa: | 5 minutes |
| Glenpool: | 4 minutes |
| Jenks: | 5 minutes |
| Sand Springs: | 6 minutes |
| Tulsa: | 4 minutes |
| Bixby: | 5 minutes |
| Beggs: | 10 minutes |
| Broken Arrow: | 6 minutes |
| Bristow: | 8 minutes |
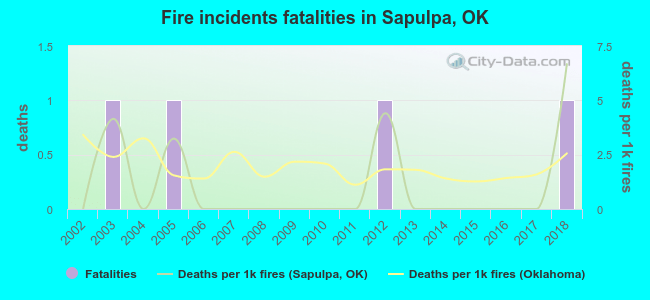 According to the reports from the years 2002 - 2018 the average number of fire-related yearly deaths is 0. The highest number of reported deaths - 1 took place in 2003, and the lowest - 0 in 2002. The data has an increasing trend.
The average number of fatalities per 1,000 fires is 1. This indicator was the highest - 7 in 2018, and the lowest 0 in 2002. The trend for deaths per 1,000 fires is growing. Compared to the state value the number of fatalities per 1,000 fires is lower.
According to the reports from the years 2002 - 2018 the average number of fire-related yearly deaths is 0. The highest number of reported deaths - 1 took place in 2003, and the lowest - 0 in 2002. The data has an increasing trend.
The average number of fatalities per 1,000 fires is 1. This indicator was the highest - 7 in 2018, and the lowest 0 in 2002. The trend for deaths per 1,000 fires is growing. Compared to the state value the number of fatalities per 1,000 fires is lower.Deaths per 1,000 incidents in Sapulpa, OK compared to nearest cities:
(Note: Based on data for all years, including only cities with at least 2,500 fire incidents)
| Sapulpa: | 1.1 |
| Sand Springs: | 1.6 |
| Tulsa: | 3.1 |
| Broken Arrow: | 1.4 |
| Claremore: | 0.9 |
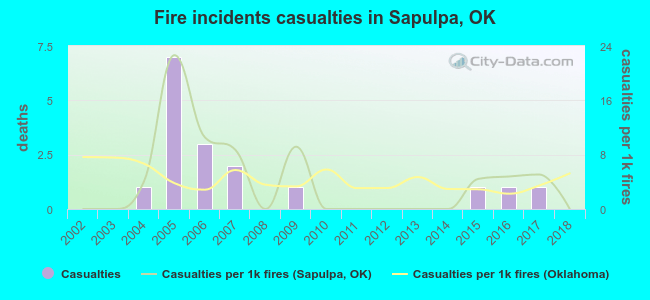 Based on the reports from the years 2002 - 2018 the average number of fire-related yearly casualties is 1. The highest number of reported casualties - 7 took place in 2005, and the lowest - 0 in 2002. The data has a constant trend.
The average number of casualties per 1,000 fire incidents is 4. This indicator was the highest - 23 in 2005, and the lowest 0 in 2002. The trend for injuries per 1,000 incidents is constant. Compared to the Oklahoma value the number of injuries per 1,000 fire incidents is about the same.
Based on the reports from the years 2002 - 2018 the average number of fire-related yearly casualties is 1. The highest number of reported casualties - 7 took place in 2005, and the lowest - 0 in 2002. The data has a constant trend.
The average number of casualties per 1,000 fire incidents is 4. This indicator was the highest - 23 in 2005, and the lowest 0 in 2002. The trend for injuries per 1,000 incidents is constant. Compared to the Oklahoma value the number of injuries per 1,000 fire incidents is about the same.Casualties per 1,000 incidents in Sapulpa, OK compared to nearest cities:
(Note: Based on data for all years, including only cities with at least 500 fire incidents)
| Sapulpa: | 4.7 |
| Glenpool: | 2.5 |
| Jenks: | 0.0 |
| Sand Springs: | 8.5 |
| Tulsa: | 5.8 |
| Bixby: | 1.0 |
| Beggs: | 0.0 |
| Broken Arrow: | 5.7 |
| Bristow: | 0.0 |
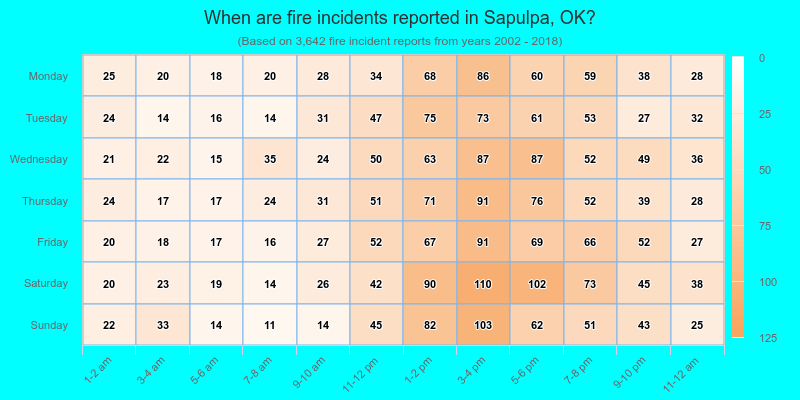
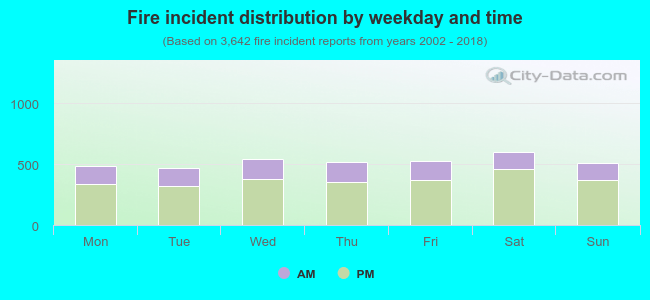 29.0% incidents where reported in the morning and 71.0% in the evening. The most fires (16.5%) took place on Saturday, and the least (12.8%) on Tuesday.
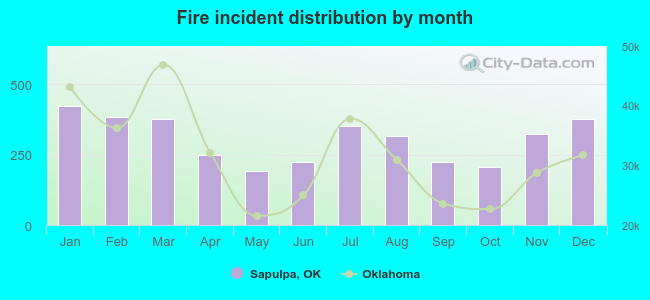 According to the 3,642 fires from years 2002 - 2018 most fires (11.6%) took place during January, and the least (5.3%) in May.
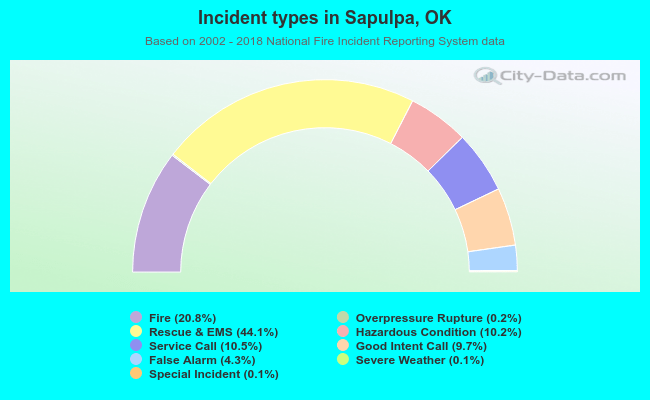 Out of all 17,530 cases reported during the years 2002 - 2018, the most belonged to the categories: Rescue & EMS (44.1%), Fire (20.8%), and Service Call (10.5%).
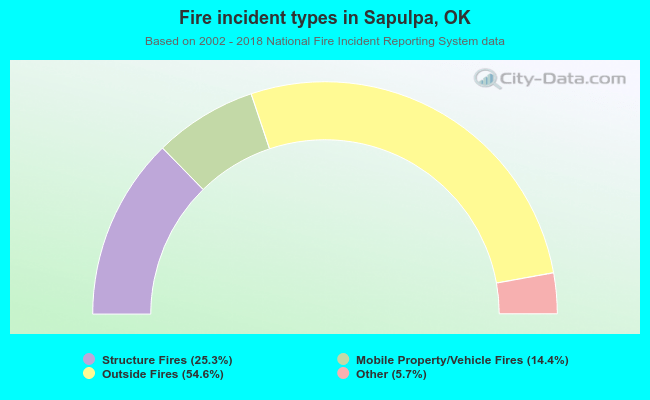 When looking into fire subcategories, the most reports belonged to: Outside Fires (54.6%), and Structure Fires (25.3%).