Lisle: Fire Incidents, Illinois (IL)
Where are fire incidents reported in Lisle, IL
Something went wrong! Please refresh the page.
| Fire incidents reported | |
|---|---|
| Sreet name | Count |
| OGDEN AV | 74 |
| WARRENVILLE RD | 66 |
| MAPLE AV | 52 |
| LAKE TRAIL DR | 44 |
| MAIN ST | 40 |
| OAKWOOD DR | 40 |
| BURLINGTON AV | 36 |
| COLLEGE RD | 36 |
| BURR OAK RD | 34 |
| FRONT ST | 30 |
| FOREST VIEW RD | 28 |
| ABBEY DR | 26 |
| ABBEYWOOD DR | 22 |
| OGDEN | 20 |
| WELLINGTON AV | 20 |
| WESTVIEW LN | 20 |
| LAKE VALLEY DR | 18 |
| SHORT ST | 18 |
| WINDSOR DR | 18 |
| ST JOSEPH CREEK RD | 16 |
| BEAU MONDE DR | 14 |
| CENTER AV | 14 |
| MAPLE | 14 |
| MEADOW DR | 14 |
| OHIO ST | 14 |
| ROUTE 53 | 14 |
| WALNUT CREEK LN | 14 |
| BLACKHAWK LN | 12 |
| CABOT DR | 12 |
| GAMBLE DR | 12 |
| Other | 319 |
2003 - 2018 National Fire Incident Reporting System (NFIRS) incidents
- Incident types reported to NFIRS in Lisle, IL
- 9,62558.5%Rescue & EMS
- 2,31214.1%False Alarm
- 1,3388.1%Hazardous Condition
- 1,2657.7%Service Call
- 1,1116.8%Fire
- 7684.7%Good Intent Call
- 280.2%Overpressure Rupture
- Fire incident types reported to NFIRS in Lisle, IL
- 40836.7%Structure Fires
- 35331.8%Outside Fires
- 25923.3%Mobile Property/Vehicle Fires
- 918.2%Other
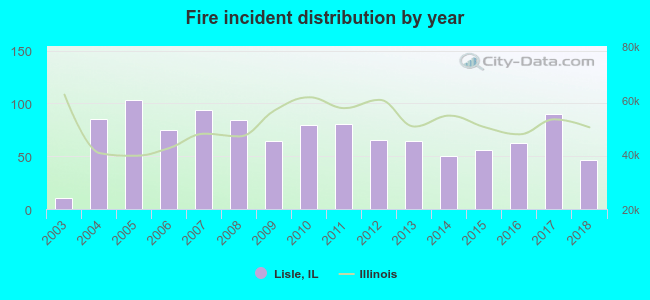 According to the data from the years 2003 - 2018 the average number of fires per year is 69. The highest number of fires - 103 took place in 2005, and the least - 10 in 2003. The data has a growing trend.
The average number of yearly fire incidents per 10k residents in Lisle, IL compared to nearest cities:
(Note: Based on data for the last 3 years, including only cities with population 5,000 and above)
| Lisle: | 29.1 |
| Downers Grove: | 20.0 |
| Woodridge: | 20.6 |
| Naperville: | 16.1 |
| Wheaton: | 18.3 |
| Glen Ellyn: | 26.9 |
| Westmont: | 22.6 |
| Warrenville: | 33.7 |
| Darien: | 21.1 |
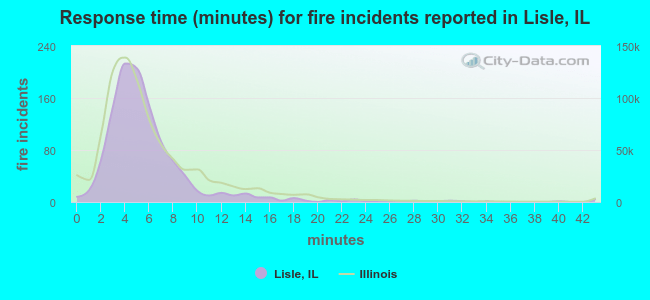 The median response time based on all reported fire incidents is 5 minutes. This is comparable to the Illinois median value.
The median response time in Lisle, IL compared to nearest cities:
(Note: Based on data for all years, including only cities with at least 500 fire incidents)
| Lisle: | 5 minutes |
| Downers Grove: | 5 minutes |
| Woodridge: | 5 minutes |
| Naperville: | 5 minutes |
| Wheaton: | 5 minutes |
| Glen Ellyn: | 6 minutes |
| Westmont: | 5 minutes |
| Warrenville: | 5 minutes |
| Darien: | 5 minutes |
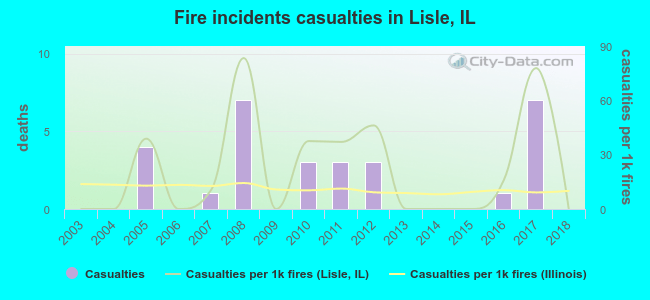 Based on the data from the years 2003 - 2018 the average number of fire-related yearly casualties is 2. The highest number of reported injuries - 7 took place in 2008, and the lowest - 0 in 2003. The data has a constant trend.
The average number of casualties per 1,000 fires is 22. This indicator was the highest - 83 in 2008, and the lowest 0 in 2003. The trend for injuries per 1,000 fire incidents is constant. Compared to the Illinois value the number of casualties per 1,000 fire incidents is much higher.
Based on the data from the years 2003 - 2018 the average number of fire-related yearly casualties is 2. The highest number of reported injuries - 7 took place in 2008, and the lowest - 0 in 2003. The data has a constant trend.
The average number of casualties per 1,000 fires is 22. This indicator was the highest - 83 in 2008, and the lowest 0 in 2003. The trend for injuries per 1,000 fire incidents is constant. Compared to the Illinois value the number of casualties per 1,000 fire incidents is much higher.Casualties per 1,000 incidents in Lisle, IL compared to nearest cities:
(Note: Based on data for all years, including only cities with at least 500 fire incidents)
| Lisle: | 26.1 |
| Downers Grove: | 21.9 |
| Woodridge: | 19.9 |
| Naperville: | 23.5 |
| Wheaton: | 12.6 |
| Glen Ellyn: | 12.2 |
| Westmont: | 21.2 |
| Warrenville: | 33.4 |
| Darien: | 12.9 |
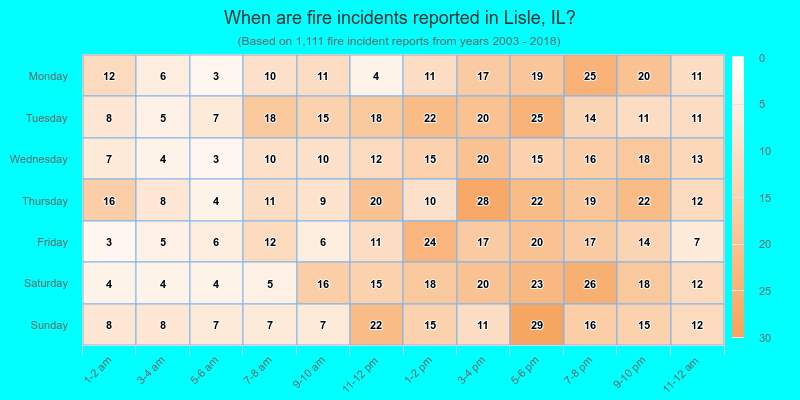
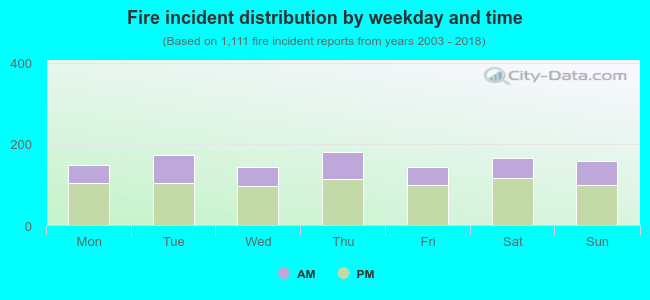 34.3% incidents where reported in the morning and 65.7% in the evening. The most fires (16.3%) took place on Thursday, and the least (12.8%) on Friday.
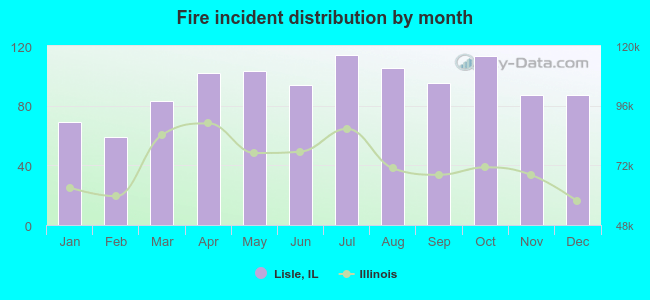 Based on the 1,111 incident reports from years 2003 - 2018 most fires (10.3%) took place during July, and the least (5.3%) in February.
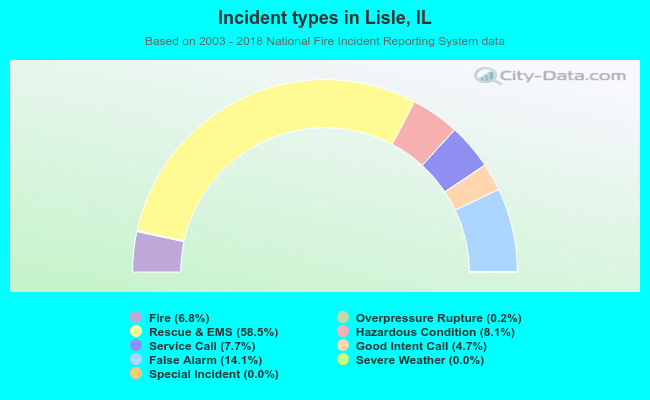 Out of all 16,454 cases reported during the years 2003 - 2018, the most belonged to the categories: Rescue & EMS (58.5%), False Alarm (14.1%), and Hazardous Condition (8.1%).
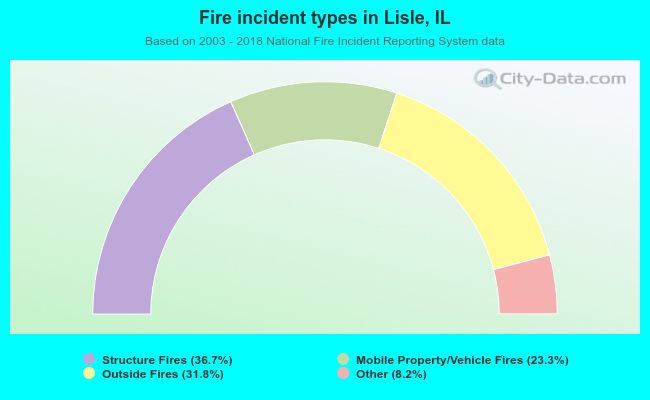 When looking into fire subcategories, the most reports belonged to: Structure Fires (36.7%), and Outside Fires (31.8%).