Dearborn Heights: Fire Incidents, Michigan (MI)
Where are fire incidents reported in Dearborn Heights, MI
Something went wrong! Please refresh the page.
| Fire incidents reported | |
|---|---|
| Sreet name | Count |
| TELEGRAPH | 176 |
| FORD RD | 150 |
| BEECH DALY | 116 |
| ANNAPOLIS | 112 |
| WARREN | 106 |
| VAN BORN | 88 |
| GULLEY | 80 |
| POWERS | 74 |
| CHARLESWORTH | 42 |
| LEHIGH | 40 |
| PARDEE | 38 |
| HANOVER | 36 |
| NIGHTINGALE | 36 |
| PENNIE | 34 |
| EVANGELINE | 32 |
| HURON | 32 |
| WHITEFIELD | 32 |
| ANDOVER | 30 |
| INKSTER RD | 30 |
| KINLOCH | 30 |
| KINMORE | 30 |
| OUTER DRIVE | 30 |
| POLK | 30 |
| COLONIAL | 28 |
| CORNELL | 28 |
| ETON | 28 |
| GRAYFIELD | 28 |
| HASS | 28 |
| HAZELTON | 28 |
| HIGHVIEW | 28 |
| Other | 452 |
2002 - 2018 National Fire Incident Reporting System (NFIRS) incidents
- Incident types reported to NFIRS in Dearborn Heights, MI
- 5,91245.7%Rescue & EMS
- 3,03123.4%Hazardous Condition
- 2,05215.9%Fire
- 8746.8%Good Intent Call
- 8176.3%False Alarm
- 1220.9%Service Call
- 1070.8%Special Incident
- 290.2%Overpressure Rupture
- Fire incident types reported to NFIRS in Dearborn Heights, MI
- 98347.9%Structure Fires
- 50324.5%Outside Fires
- 44121.5%Mobile Property/Vehicle Fires
- 1256.1%Other
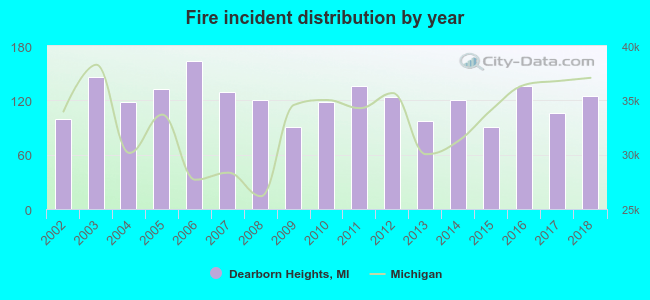 Based on the data from the years 2002 - 2018 the average number of fires per year is 121. The highest number of fire incidents - 163 took place in 2006, and the least - 91 in 2009. The data has a growing trend.
The average number of yearly fire incidents per 10k residents in Dearborn Heights, MI compared to nearest cities:
(Note: Based on data for the last 3 years, including only cities with population 5,000 and above)
| Dearborn Heights: | 21.7 |
| Inkster: | 58.9 |
| Garden City: | 29.7 |
| Dearborn: | 28.1 |
| Westland: | 25.0 |
| Wayne: | 44.5 |
| Allen Park: | 25.0 |
| Taylor: | 28.1 |
| Melvindale: | 31.6 |
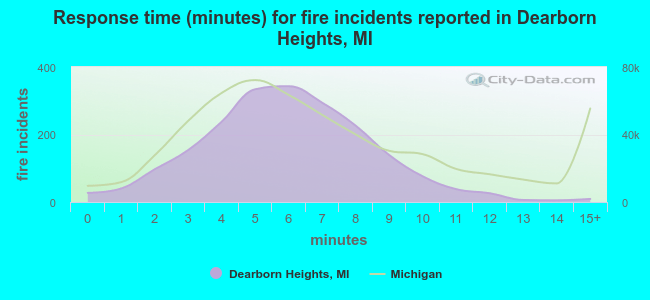 The median response time based on all reported fire incidents is 6 minutes. This is comparable to the Michigan median value.
The median response time in Dearborn Heights, MI compared to nearest cities:
(Note: Based on data for all years, including only cities with at least 500 fire incidents)
| Dearborn Heights: | 6 minutes |
| Inkster: | 5 minutes |
| Garden City: | 5 minutes |
| Dearborn: | 4 minutes |
| Westland: | 6 minutes |
| Wayne: | 5 minutes |
| Allen Park: | 5 minutes |
| Taylor: | 4 minutes |
| Melvindale: | 3 minutes |
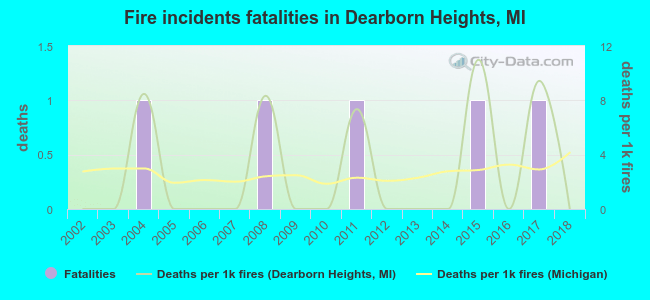 According to the data from the years 2002 - 2018 the average number of fire-related fatalities per year is 0. The highest number of reported deaths - 1 took place in 2004, and the lowest - 0 in 2002. The data has a constant trend.
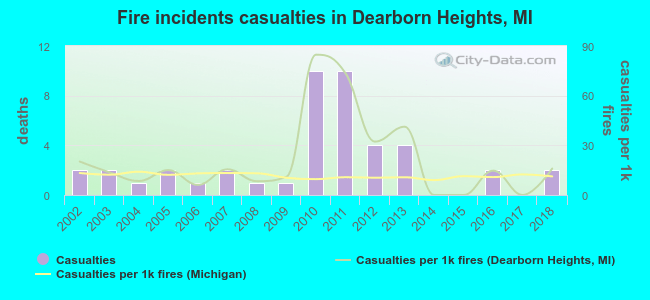 Based on the data from the years 2002 - 2018 the average number of fire-related yearly casualties is 3. The highest number of injuries - 10 took place in 2010, and the lowest - 0 in 2014. The data has a constant trend.
The average number of casualties per 1,000 fire incidents is 21. This indicator was the highest - 85 in 2010, and the lowest 0 in 2014. The trend for injuries per 1,000 incidents is decreasing. Compared to the state value the number of casualties per 1,000 fires is higher.
Based on the data from the years 2002 - 2018 the average number of fire-related yearly casualties is 3. The highest number of injuries - 10 took place in 2010, and the lowest - 0 in 2014. The data has a constant trend.
The average number of casualties per 1,000 fire incidents is 21. This indicator was the highest - 85 in 2010, and the lowest 0 in 2014. The trend for injuries per 1,000 incidents is decreasing. Compared to the state value the number of casualties per 1,000 fires is higher.Casualties per 1,000 incidents in Dearborn Heights, MI compared to nearest cities:
(Note: Based on data for all years, including only cities with at least 500 fire incidents)
| Dearborn Heights: | 21.4 |
| Inkster: | 8.1 |
| Garden City: | 29.5 |
| Dearborn: | 23.8 |
| Westland: | 14.1 |
| Wayne: | 31.8 |
| Allen Park: | 3.9 |
| Taylor: | 19.3 |
| Melvindale: | 30.6 |
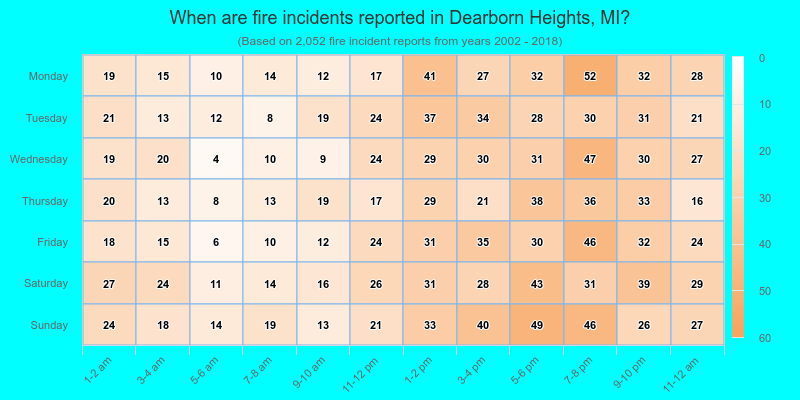
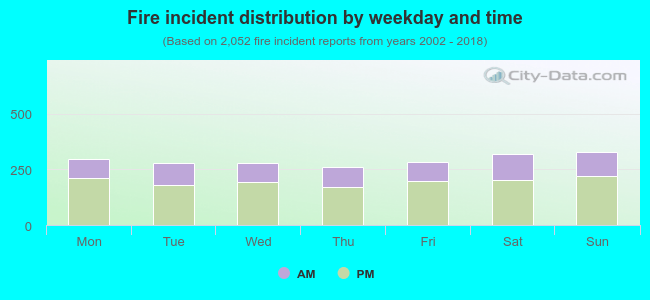 32.7% incidents where reported in the morning and 67.3% in the evening. The most fires (16.1%) took place on Sunday, and the least (12.8%) on Thursday.
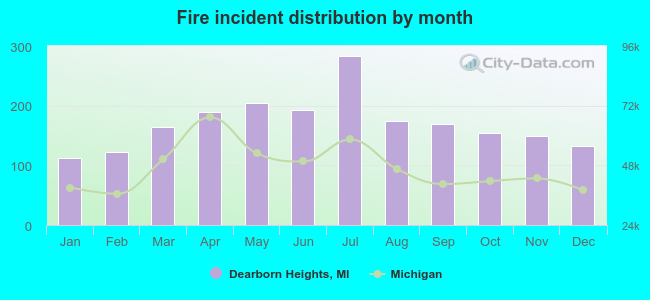 According to the 2,052 fire incidents from years 2002 - 2018 most fires (13.8%) took place during July, and the least (5.5%) in January.
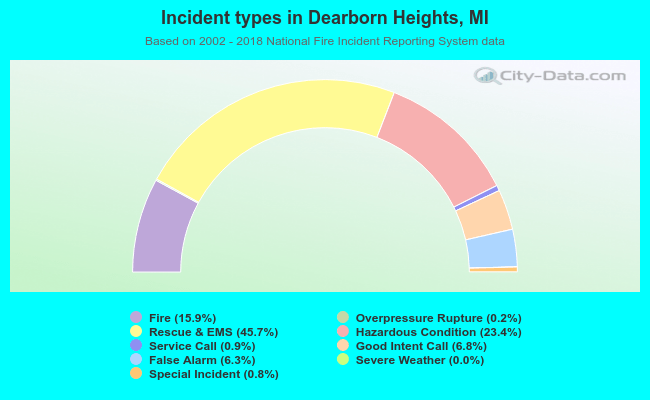 Out of all 12,945 cases reported during the years 2002 - 2018, the most belonged to the categories: Rescue & EMS (45.7%), Hazardous Condition (23.4%), and Fire (15.9%).
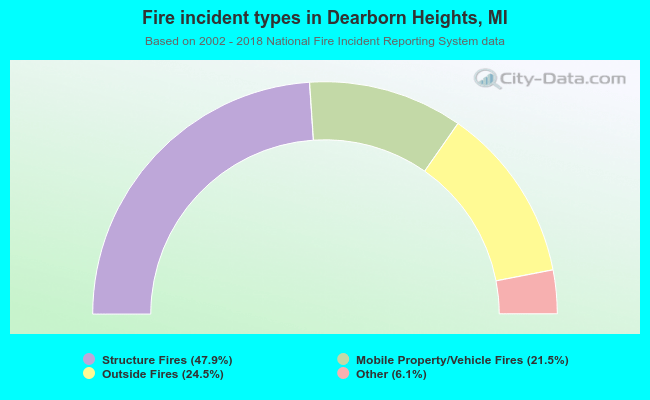 When looking into fire subcategories, the most incidents belonged to: Structure Fires (47.9%), and Outside Fires (24.5%).