Garden City: Fire Incidents, Michigan (MI)
Where are fire incidents reported in Garden City, MI
Something went wrong! Please refresh the page.
| Fire incidents reported | |
|---|---|
| Sreet name | Count |
| FORD RD | 108 |
| MARQUETTE | 94 |
| FORD | 78 |
| FLORENCE | 66 |
| MIDDLEBELT | 62 |
| BLOCK | 50 |
| HARRISON | 48 |
| ROSSLYN | 48 |
| BEECHWOOD | 46 |
| JOHN HAUK | 44 |
| BARTON | 42 |
| MIDDLEBELT ST | 42 |
| BOCK | 38 |
| SHERIDAN | 36 |
| PARDO | 34 |
| GILMAN | 32 |
| HELEN | 32 |
| KRAUTER | 32 |
| RUSH | 32 |
| HENNEPIN | 30 |
| WINDSOR | 30 |
| CAMBRIDGE | 28 |
| ELMWOOD | 28 |
| INKSTER RD | 28 |
| MAPLEWOOD | 28 |
| PIERCE | 28 |
| WARREN AVE | 28 |
| CARDWELL | 26 |
| DONNELLY | 26 |
| MIDDLEBELT RD | 26 |
2002 - 2018 National Fire Incident Reporting System (NFIRS) incidents
- Incident types reported to NFIRS in Garden City, MI
- 11,33572.7%Rescue & EMS
- 1,4099.0%Hazardous Condition
- 9836.3%Fire
- 6474.2%Good Intent Call
- 6384.1%Service Call
- 5023.2%False Alarm
- 540.3%Special Incident
- Fire incident types reported to NFIRS in Garden City, MI
- 51152.0%Structure Fires
- 24625.0%Outside Fires
- 15215.5%Mobile Property/Vehicle Fires
- 747.5%Other
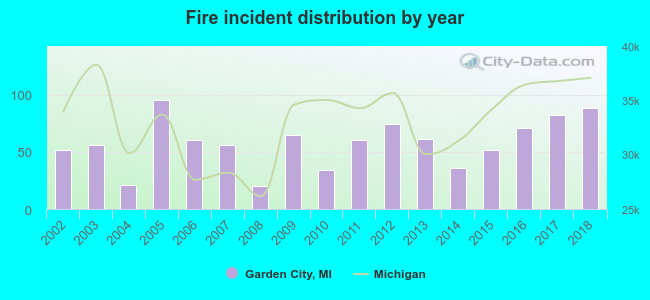 Based on the data from the years 2002 - 2018 the average number of fire incidents per year is 58. The highest number of fire incidents - 95 took place in 2005, and the least - 20 in 2008. The data has a growing trend.
The average number of yearly fire incidents per 10k residents in Garden City, MI compared to nearest cities:
(Note: Based on data for the last 3 years, including only cities with population 5,000 and above)
| Garden City: | 29.7 |
| Westland: | 25.0 |
| Inkster: | 58.9 |
| Dearborn Heights: | 21.7 |
| Wayne: | 44.5 |
| Livonia: | 14.2 |
| Redford: | 0.2 |
| Dearborn: | 28.1 |
| Romulus: | 49.8 |
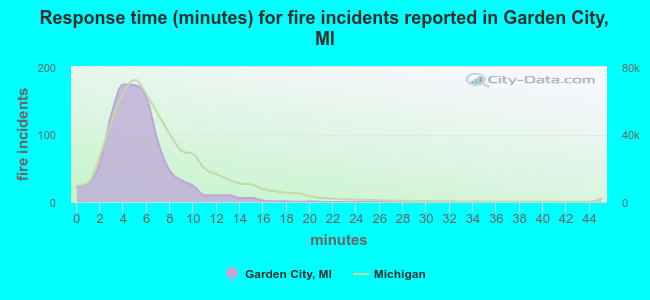 The median response time based on all reported fire incidents is 5 minutes. This is lower compared to the Michigan median value.
The median response time in Garden City, MI compared to nearest cities:
(Note: Based on data for all years, including only cities with at least 500 fire incidents)
| Garden City: | 5 minutes |
| Westland: | 6 minutes |
| Inkster: | 5 minutes |
| Dearborn Heights: | 6 minutes |
| Wayne: | 5 minutes |
| Livonia: | 4 minutes |
| Dearborn: | 4 minutes |
| Romulus: | 7 minutes |
| Canton: | 6 minutes |
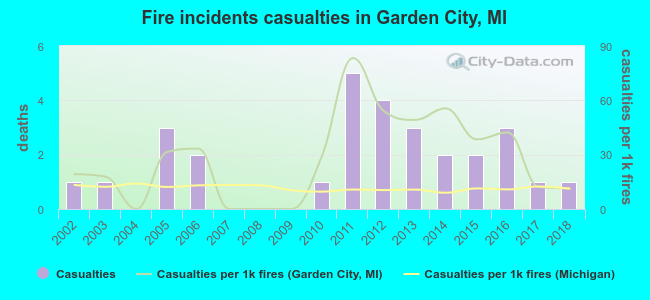 According to the reports from the years 2002 - 2018 the average number of fire-related yearly casualties is 2. The highest number of casualties - 5 took place in 2011, and the lowest - 0 in 2004. The data has a constant trend.
The average number of casualties per 1,000 fire incidents is 28. This indicator was the highest - 83 in 2011, and the lowest 0 in 2004. The trend for injuries per 1,000 fire incidents is dropping. Compared to the Michigan value the number of injuries per 1,000 fires is much higher.
According to the reports from the years 2002 - 2018 the average number of fire-related yearly casualties is 2. The highest number of casualties - 5 took place in 2011, and the lowest - 0 in 2004. The data has a constant trend.
The average number of casualties per 1,000 fire incidents is 28. This indicator was the highest - 83 in 2011, and the lowest 0 in 2004. The trend for injuries per 1,000 fire incidents is dropping. Compared to the Michigan value the number of injuries per 1,000 fires is much higher.
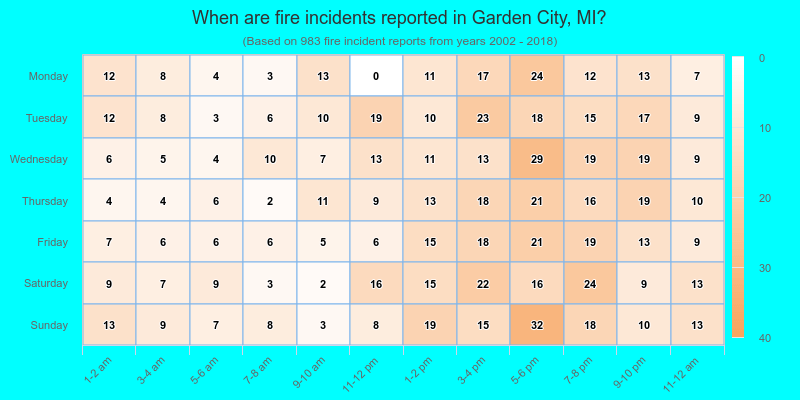
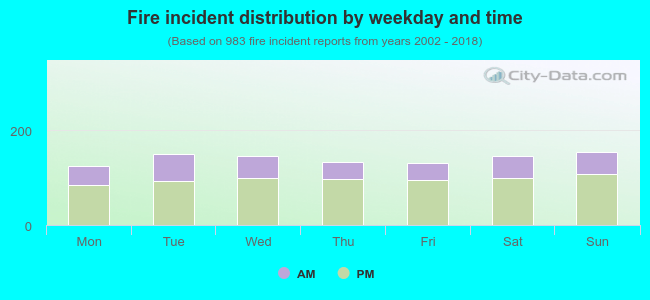 31.4% incidents where reported in the morning and 68.6% in the evening. The most fires (15.8%) took place on Sunday, and the least (12.6%) on Monday.
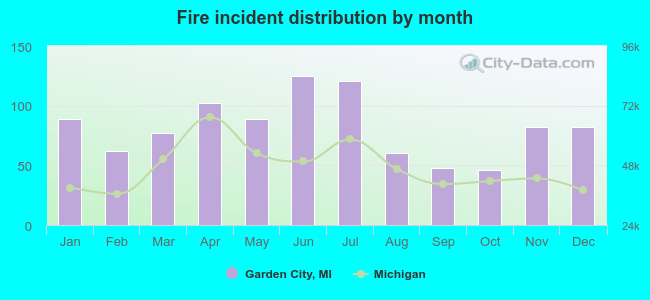 Based on the 983 fire incident reports from years 2002 - 2018 most fires (12.7%) took place during June, and the least (4.7%) in October.
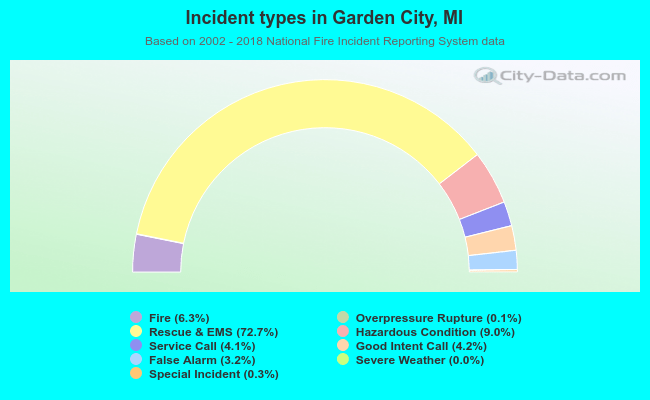 Out of all 15,582 cases reported during the years 2002 - 2018, the most belonged to the categories: Rescue & EMS (72.7%), Hazardous Condition (9.0%), and Fire (6.3%).
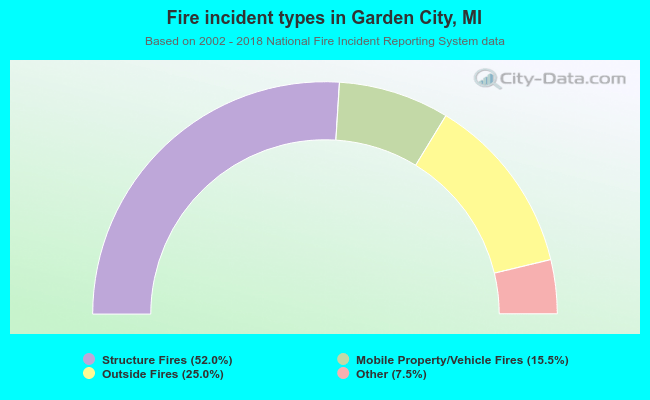 When looking into fire subcategories, the most incidents belonged to: Structure Fires (52.0%), and Outside Fires (25.0%).