Des Moines: Fire Incidents, Iowa (IA)
Where are fire incidents reported in Des Moines, IA
Something went wrong! Please refresh the page.
| Fire incidents reported | |
|---|---|
| Sreet name | Count |
| 14TH ST | 928 |
| 9TH ST | 668 |
| GRAND AVE | 532 |
| UNIVERSITY AVE | 440 |
| DOUGLAS AVE | 410 |
| EUCLID AVE | 378 |
| 30TH ST | 360 |
| 6TH AVE | 324 |
| 5TH ST | 322 |
| HUBBELL AVE | 272 |
| 7TH ST | 260 |
| 22ND ST | 258 |
| 8TH ST | 258 |
| 12TH ST | 252 |
| 16TH ST | 242 |
| ARMY POST RD | 240 |
| MARTIN LUTHER KING J PKY | 240 |
| WALNUT ST | 218 |
| MERLE HAY RD | 212 |
| 13TH ST | 210 |
| FLEUR DR | 206 |
| 15TH ST | 194 |
| PARK AVE | 184 |
| 18TH ST | 174 |
| 2ND AVE | 170 |
| DES MOINES ST | 170 |
| 17TH ST | 166 |
| HICKMAN RD | 166 |
| CAPITOL AVE | 164 |
| 21ST ST | 162 |
| Other | 3,934 |
2002 - 2017 National Fire Incident Reporting System (NFIRS) incidents
- Incident types reported to NFIRS in Des Moines, IA
- 72,16963.0%Rescue & EMS
- 12,71411.1%Fire
- 9,9238.7%Service Call
- 7,1296.2%Good Intent Call
- 6,5845.8%False Alarm
- 4,7014.1%Hazardous Condition
- 1,0891.0%Overpressure Rupture
- 1250.1%Special Incident
- Fire incident types reported to NFIRS in Des Moines, IA
- 4,73837.3%Structure Fires
- 4,44835.0%Outside Fires
- 2,92723.0%Mobile Property/Vehicle Fires
- 6014.7%Other
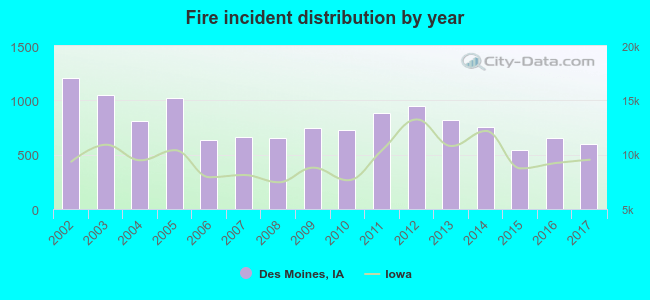 According to the data from the years 2002 - 2017 the average number of fire incidents per year is 794. The highest number of fire incidents - 1,210 took place in 2002, and the least - 542 in 2015. The data has a dropping trend.
The average number of yearly fire incidents per 10k residents in Des Moines, IA compared to nearest cities:
(Note: Based on data for the last 3 years, including only cities with population 5,000 and above)
| Des Moines: | 20.0 |
| Pleasant Hill: | 13.1 |
| Urbandale: | 10.8 |
| West Des Moines: | 13.6 |
| Johnston: | 21.4 |
| Norwalk: | 2.0 |
| Clive: | 16.4 |
| Altoona: | 12.6 |
| Ankeny: | 1.4 |
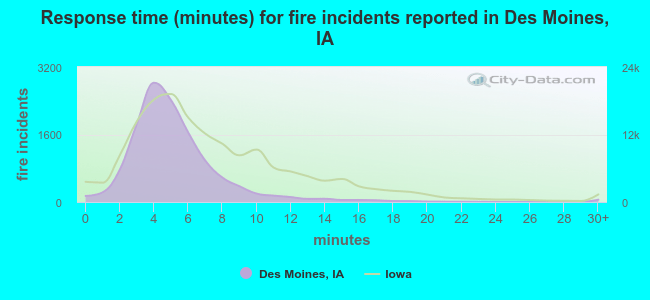 The median response time based on all reported fire incidents is 5 minutes. This is lower than the Iowa median value.
The median response time in Des Moines, IA compared to nearest cities:
(Note: Based on data for all years, including only cities with at least 500 fire incidents)
| Des Moines: | 5 minutes |
| Pleasant Hill: | 10 minutes |
| Urbandale: | 7 minutes |
| West Des Moines: | 6 minutes |
| Johnston: | 9 minutes |
| Clive: | 6 minutes |
| Altoona: | 7 minutes |
| Ankeny: | 7 minutes |
| Indianola: | 8 minutes |
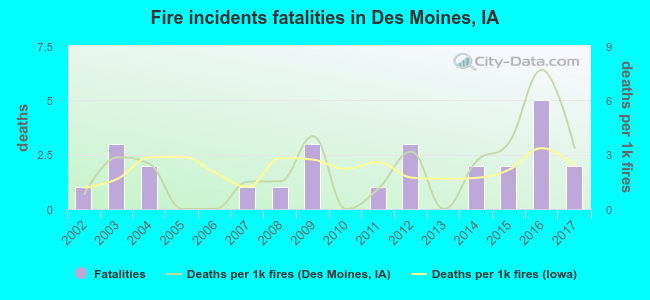 Based on the data from the years 2002 - 2017 the average number of fire-related fatalities per year is 2. The highest number of deaths - 5 took place in 2016, and the lowest - 0 in 2005. The data has an increasing trend.
The average number of deaths per 1,000 fire incidents is 2. This indicator was the highest - 8 in 2016, and the lowest 0 in 2005. The trend for deaths per 1,000 fire incidents is rising. Compared to the Iowa value the number of deaths per 1,000 fire incidents is about the same.
Based on the data from the years 2002 - 2017 the average number of fire-related fatalities per year is 2. The highest number of deaths - 5 took place in 2016, and the lowest - 0 in 2005. The data has an increasing trend.
The average number of deaths per 1,000 fire incidents is 2. This indicator was the highest - 8 in 2016, and the lowest 0 in 2005. The trend for deaths per 1,000 fire incidents is rising. Compared to the Iowa value the number of deaths per 1,000 fire incidents is about the same.Deaths per 1,000 incidents in Des Moines, IA compared to nearest cities:
(Note: Based on data for all years, including only cities with at least 2,500 fire incidents)
| Des Moines: | 2.0 |
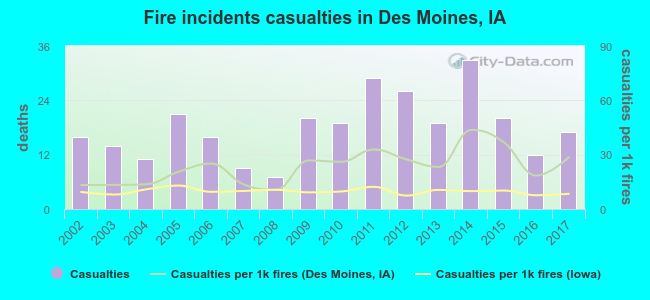 According to the reports from the years 2002 - 2017 the average number of fire-related yearly casualties is 18. The highest number of reported injuries - 33 took place in 2014, and the lowest - 7 in 2008. The data has a growing trend.
The average number of injuries per 1,000 fire incidents is 23. This indicator was the highest - 44 in 2014, and the lowest 11 in 2008. The trend for casualties per 1,000 incidents is growing. Compared to the state value the number of injuries per 1,000 fire incidents is much higher.
According to the reports from the years 2002 - 2017 the average number of fire-related yearly casualties is 18. The highest number of reported injuries - 33 took place in 2014, and the lowest - 7 in 2008. The data has a growing trend.
The average number of injuries per 1,000 fire incidents is 23. This indicator was the highest - 44 in 2014, and the lowest 11 in 2008. The trend for casualties per 1,000 incidents is growing. Compared to the state value the number of injuries per 1,000 fire incidents is much higher.Casualties per 1,000 incidents in Des Moines, IA compared to nearest cities:
(Note: Based on data for all years, including only cities with at least 500 fire incidents)
| Des Moines: | 22.7 |
| Pleasant Hill: | 3.2 |
| Urbandale: | 11.9 |
| West Des Moines: | 7.6 |
| Johnston: | 0.0 |
| Clive: | 3.2 |
| Altoona: | 14.5 |
| Ankeny: | 12.5 |
| Indianola: | 18.0 |
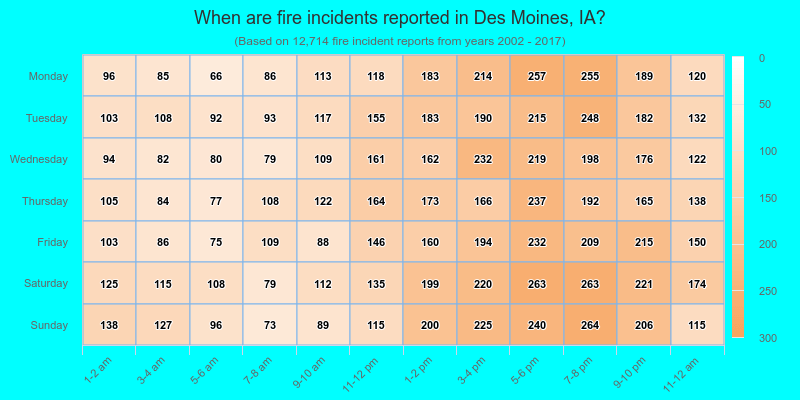
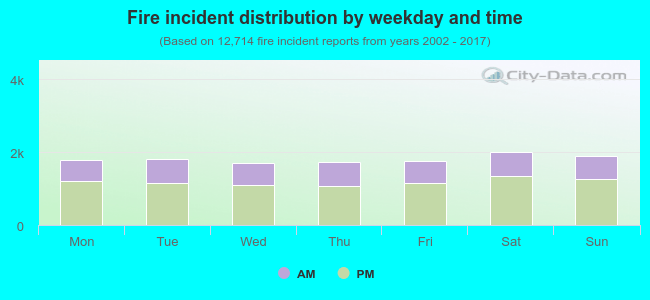 34.7% incidents where reported in the morning and 65.3% in the evening. The most fires (15.8%) took place on Saturday, and the least (13.5%) on Wednesday.
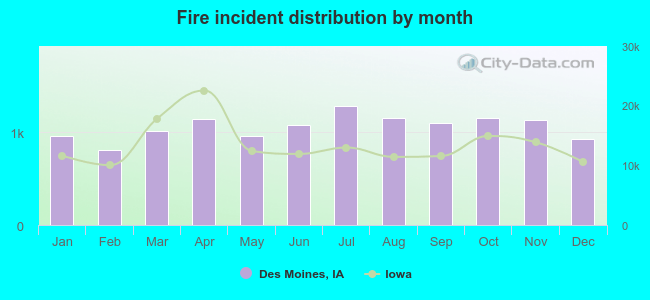 According to the 12,714 incident reports from years 2002 - 2017 most fires (10.1%) took place during July, and the least (6.4%) in February.
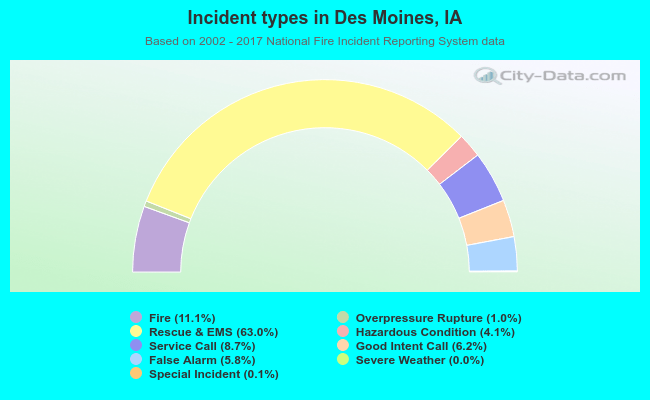 Out of all 114,468 cases reported during the years 2002 - 2017, the most belonged to the categories: Rescue & EMS (63.0%), Fire (11.1%), and Service Call (8.7%).
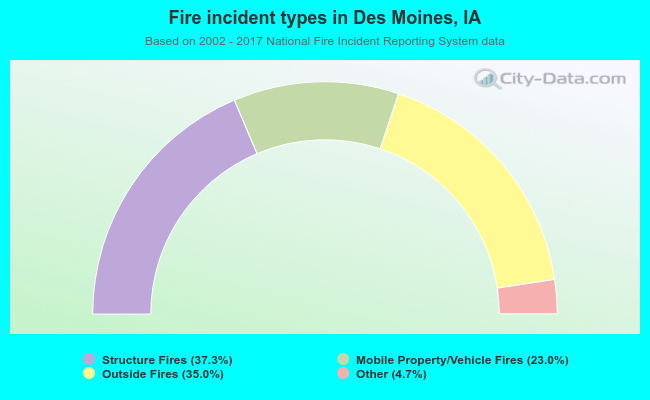 When looking into fire subcategories, the most reports belonged to: Structure Fires (37.3%), and Outside Fires (35.0%).