Johnston: Fire Incidents, Iowa (IA)
Where are fire incidents reported in Johnston, IA
Something went wrong! Please refresh the page.
|
| |||||||||||||||||||||||||||||||||||||||||||||||||||||||||||||||||||||||||||||||||||||||||||||||||||||||||||||
2003 - 2017 National Fire Incident Reporting System (NFIRS) incidents
- Incident types reported to NFIRS in Johnston, IA
- 2,37950.5%Rescue & EMS
- 66614.1%Fire
- 56311.9%False Alarm
- 4469.5%Good Intent Call
- 3447.3%Service Call
- 2946.2%Hazardous Condition
- 130.3%Overpressure Rupture
- 50.1%Severe Weather
- Fire incident types reported to NFIRS in Johnston, IA
- 32548.8%Structure Fires
- 21231.8%Outside Fires
- 9013.5%Mobile Property/Vehicle Fires
- 395.9%Other
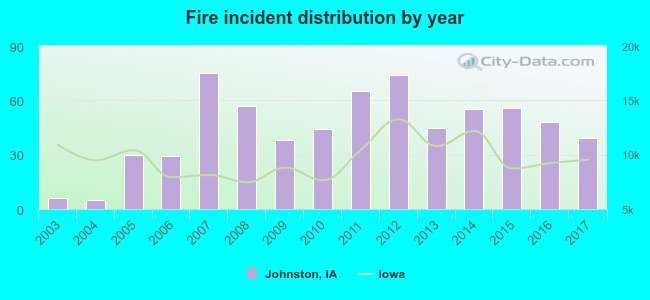 Based on the data from the years 2003 - 2017 the average number of fire incidents per year is 44. The highest number of reported fires - 75 took place in 2007, and the least - 5 in 2004. The data has an increasing trend.
The average number of yearly fire incidents per 10k residents in Johnston, IA compared to nearest cities:
(Note: Based on data for the last 3 years, including only cities with population 5,000 and above)
| Johnston: | 21.4 |
| Urbandale: | 10.8 |
| Grimes: | 20.9 |
| Clive: | 16.4 |
| Ankeny: | 1.4 |
| Des Moines: | 20.0 |
| West Des Moines: | 13.6 |
| Waukee: | 27.4 |
| Pleasant Hill: | 13.1 |
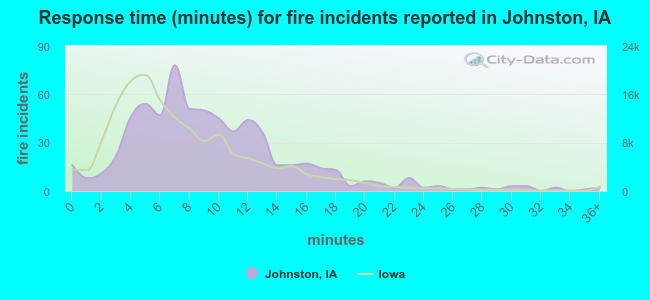 The median response time based on all reported fire incidents is 9 minutes. This is higher than the Iowa median value.
The median response time in Johnston, IA compared to nearest cities:
(Note: Based on data for all years, including only cities with at least 500 fire incidents)
| Johnston: | 9 minutes |
| Urbandale: | 7 minutes |
| Clive: | 6 minutes |
| Ankeny: | 7 minutes |
| Des Moines: | 5 minutes |
| West Des Moines: | 6 minutes |
| Pleasant Hill: | 10 minutes |
| Altoona: | 7 minutes |
| Indianola: | 8 minutes |
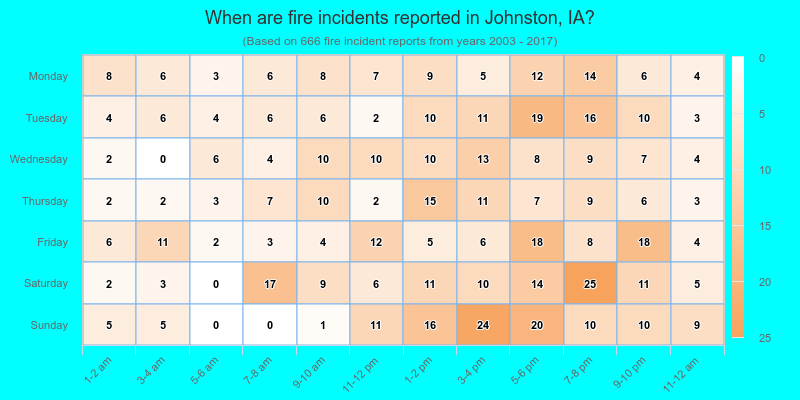
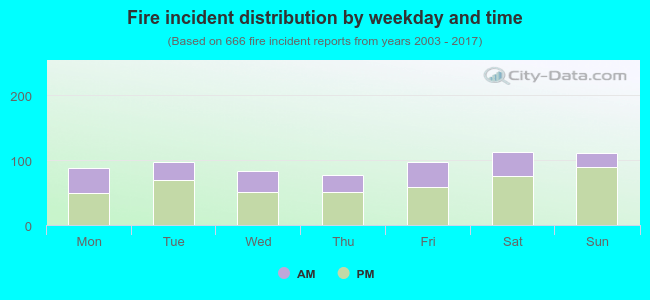 33.2% incidents where reported in the morning and 66.8% in the evening. The most fires (17.0%) took place on Saturday, and the least (11.6%) on Thursday.
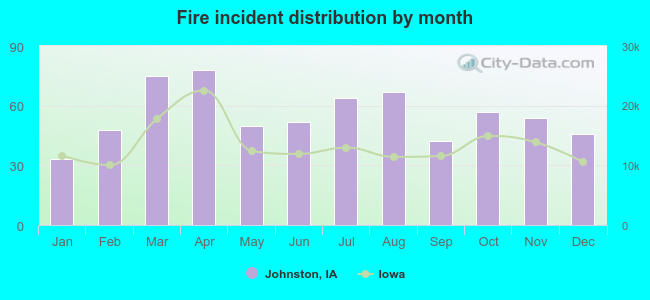 Based on the 666 fires from years 2003 - 2017 most fires (11.7%) took place during April, and the least (5.0%) in January.
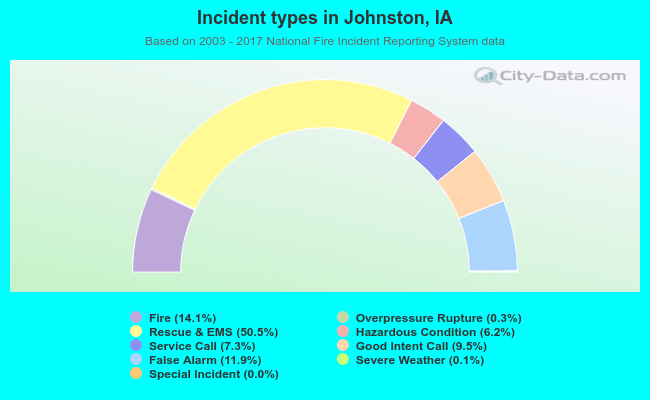 Out of all 4,712 cases reported during the years 2003 - 2017, the most belonged to the categories: Rescue & EMS (50.5%), Fire (14.1%), and False Alarm (11.9%).
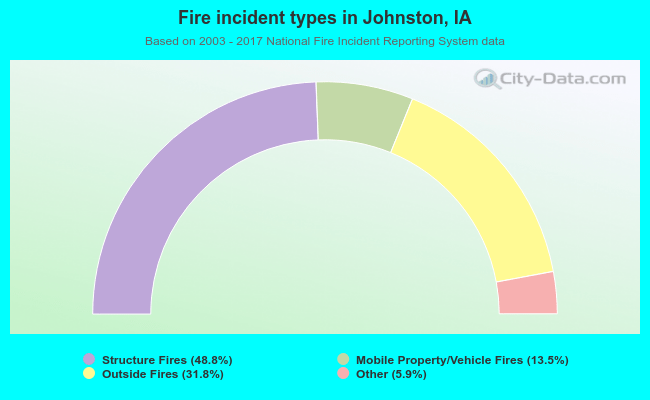 When looking into fire subcategories, the most incidents belonged to: Structure Fires (48.8%), and Outside Fires (31.8%).