Urbandale: Fire Incidents, Iowa (IA)
Where are fire incidents reported in Urbandale, IA
Something went wrong! Please refresh the page.
| Fire incidents reported | |
|---|---|
| Sreet name | Count |
| HICKMAN RD | 170 |
| 86TH ST | 166 |
| DOUGLAS AVE | 140 |
| MEREDITH DR | 90 |
| 68TH ST | 68 |
| MERLE HAY RD | 64 |
| I-8035 | 62 |
| 114TH ST | 56 |
| AURORA AVE | 46 |
| BROOKVIEW DR | 46 |
| ELM DR | 44 |
| 100TH ST | 42 |
| 70TH ST | 42 |
| 67TH ST | 38 |
| DENNIS DR | 38 |
| PATRICIA DR | 36 |
| AIRLINE AVE | 34 |
| 72ND ST | 30 |
| 78TH ST | 30 |
| CANTERBURY RD | 28 |
| PLUM DR | 28 |
| 121ST ST | 26 |
| 142ND ST | 26 |
| URBANDALE DR | 26 |
| 106TH ST | 24 |
| 69TH ST | 24 |
| DELLWOOD DR | 24 |
| ILTIS DR | 24 |
| MADISON AVE | 24 |
| RIDGEMONT DR | 24 |
2002 - 2017 National Fire Incident Reporting System (NFIRS) incidents
- Incident types reported to NFIRS in Urbandale, IA
- 7,60861.0%Rescue & EMS
- 1,45211.6%False Alarm
- 1,34110.7%Fire
- 9057.3%Hazardous Condition
- 5544.4%Good Intent Call
- 3983.2%Service Call
- 1901.5%Special Incident
- 230.2%Overpressure Rupture
- Fire incident types reported to NFIRS in Urbandale, IA
- 62446.5%Structure Fires
- 38228.5%Outside Fires
- 26319.6%Mobile Property/Vehicle Fires
- 725.4%Other
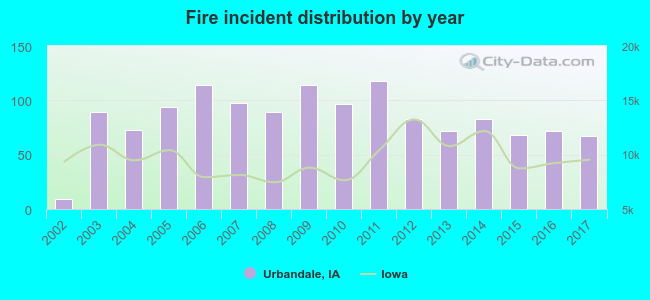 According to the data from the years 2002 - 2017 the average number of fire incidents per year is 84. The highest number of fires - 118 took place in 2011, and the least - 9 in 2002. The data has an increasing trend.
The average number of yearly fire incidents per 10k residents in Urbandale, IA compared to nearest cities:
(Note: Based on data for the last 3 years, including only cities with population 5,000 and above)
| Urbandale: | 10.8 |
| Johnston: | 21.4 |
| Clive: | 16.4 |
| Grimes: | 20.9 |
| West Des Moines: | 13.6 |
| Des Moines: | 20.0 |
| Waukee: | 27.4 |
| Ankeny: | 1.4 |
| Norwalk: | 2.0 |
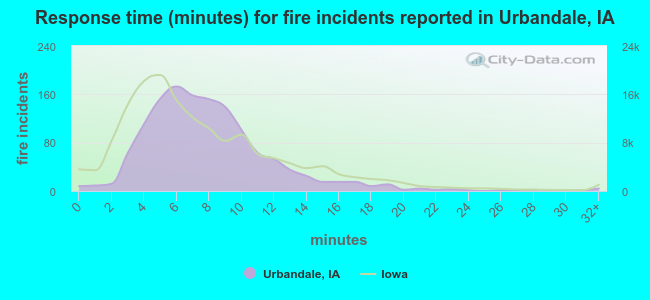 The median response time based on all reported fire incidents is 7 minutes. This is comparable to the state median value.
The median response time in Urbandale, IA compared to nearest cities:
(Note: Based on data for all years, including only cities with at least 500 fire incidents)
| Urbandale: | 7 minutes |
| Johnston: | 9 minutes |
| Clive: | 6 minutes |
| West Des Moines: | 6 minutes |
| Des Moines: | 5 minutes |
| Ankeny: | 7 minutes |
| Pleasant Hill: | 10 minutes |
| Altoona: | 7 minutes |
| Indianola: | 8 minutes |
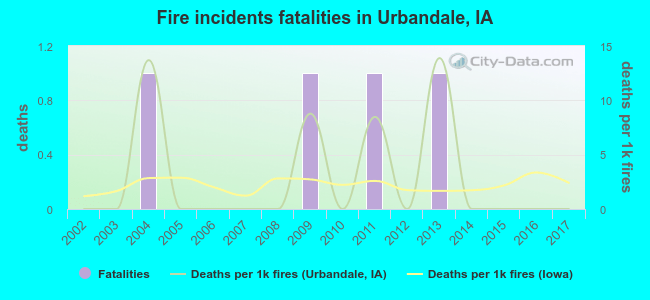 Based on the reports from the years 2002 - 2017 the average number of fire-related fatalities per year is 0. The highest number of deaths - 1 took place in 2004, and the lowest - 0 in 2002. The data has a constant trend.
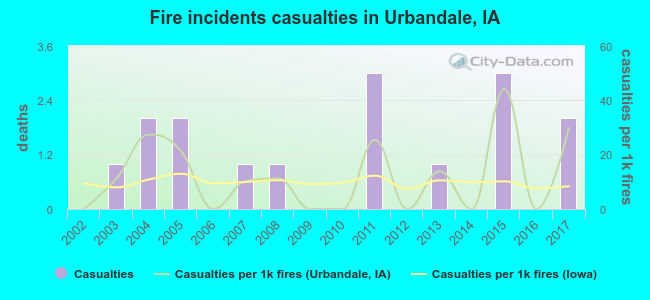 According to the data from the years 2002 - 2017 the average number of fire-related casualties per year is 1. The highest number of reported injuries - 3 took place in 2011, and the lowest - 0 in 2002. The data has a rising trend.
The average number of casualties per 1,000 fires is 12. This indicator was the highest - 44 in 2015, and the lowest 0 in 2002. The trend for injuries per 1,000 fires is rising. Compared to the Iowa value the number of casualties per 1,000 incidents is higher.
According to the data from the years 2002 - 2017 the average number of fire-related casualties per year is 1. The highest number of reported injuries - 3 took place in 2011, and the lowest - 0 in 2002. The data has a rising trend.
The average number of casualties per 1,000 fires is 12. This indicator was the highest - 44 in 2015, and the lowest 0 in 2002. The trend for injuries per 1,000 fires is rising. Compared to the Iowa value the number of casualties per 1,000 incidents is higher.Casualties per 1,000 incidents in Urbandale, IA compared to nearest cities:
(Note: Based on data for all years, including only cities with at least 500 fire incidents)
| Urbandale: | 11.9 |
| Johnston: | 0.0 |
| Clive: | 3.2 |
| West Des Moines: | 7.6 |
| Des Moines: | 22.7 |
| Ankeny: | 12.5 |
| Pleasant Hill: | 3.2 |
| Altoona: | 14.5 |
| Indianola: | 18.0 |
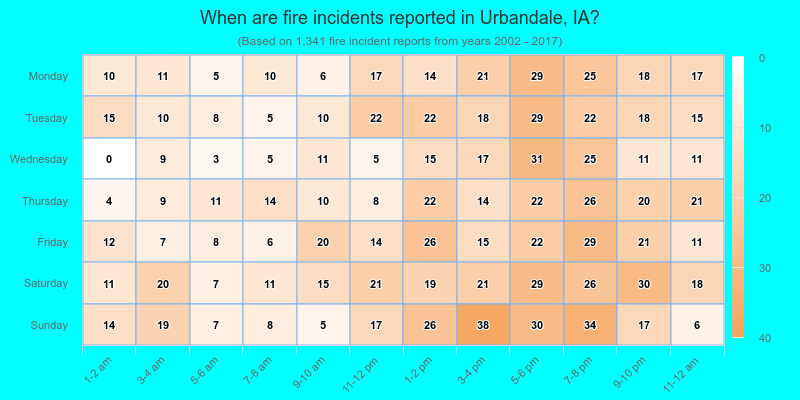
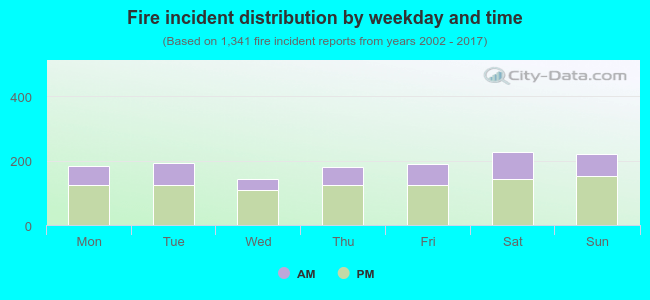 32.8% incidents where reported in the morning and 67.2% in the evening. The most fires (17.0%) took place on Saturday, and the least (10.7%) on Wednesday.
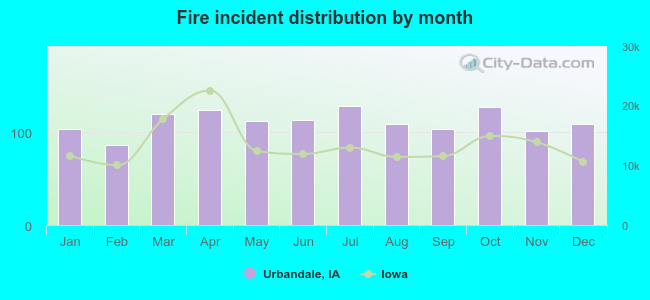 Based on the 1,341 reports from years 2002 - 2017 most fires (9.6%) took place during July, and the least (6.4%) in February.
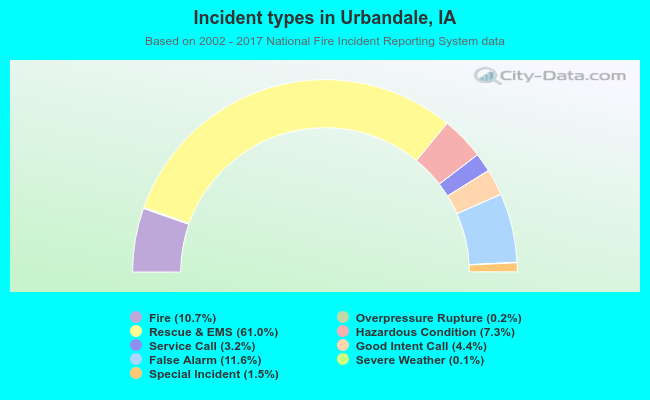 Out of all 12,479 cases reported during the years 2002 - 2017, the most belonged to the categories: Rescue & EMS (61.0%), False Alarm (11.6%), and Fire (10.7%).
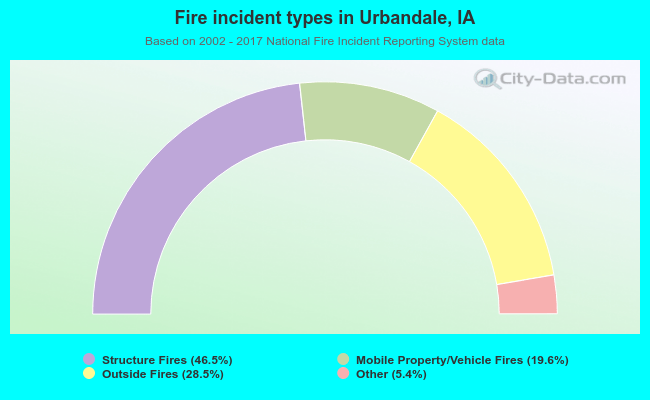 When looking into fire subcategories, the most reports belonged to: Structure Fires (46.5%), and Outside Fires (28.5%).