East Meadow: Fire Incidents, New York (NY)
Where are fire incidents reported in East Meadow, NY
Something went wrong! Please refresh the page.
|
| |||||||||||||||||||||||||||||||||||||||||||||||||||||||||||||||||||||||||||||||||||||||||||||||||||||||||||||
2005 - 2018 National Fire Incident Reporting System (NFIRS) incidents
- Incident types reported to NFIRS in East Meadow, NY
- 2,29140.4%Rescue & EMS
- 1,15620.4%Hazardous Condition
- 81314.3%False Alarm
- 66311.7%Good Intent Call
- 3987.0%Fire
- 3285.8%Service Call
- 110.2%Special Incident
- Fire incident types reported to NFIRS in East Meadow, NY
- 13734.4%Outside Fires
- 12932.4%Structure Fires
- 8421.1%Mobile Property/Vehicle Fires
- 4812.1%Other
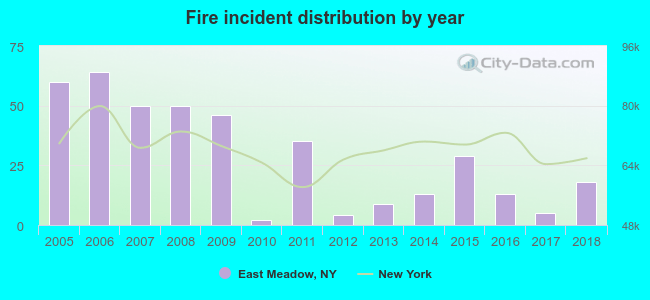 According to the data from the years 2005 - 2018 the average number of fire incidents per year is 28. The highest number of reported fires - 64 took place in 2006, and the least - 2 in 2010. The data has a dropping trend.
The average number of yearly fire incidents per 10k residents in East Meadow, NY compared to nearest cities:
(Note: Based on data for the last 3 years, including only cities with population 5,000 and above)
| East Meadow: | 3.1 |
| North Bellmore: | 5.8 |
| North Merrick: | 6.9 |
| Uniondale: | 5.1 |
| Salisbury: | 5.0 |
| Levittown: | 5.2 |
| Roosevelt: | 39.4 |
| Hempstead: | 31.0 |
| New Cassel: | 0.7 |
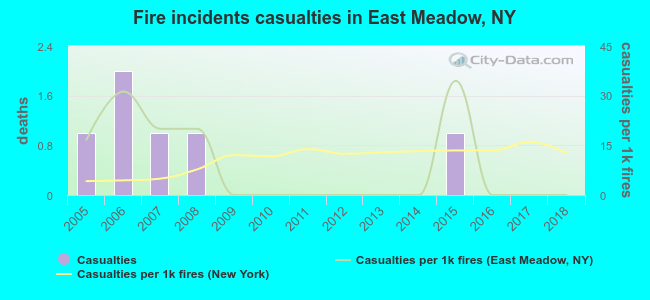 According to the reports from the years 2005 - 2018 the average number of fire-related casualties per year is 0. The highest number of injuries - 2 took place in 2006, and the lowest - 0 in 2009. The data has a dropping trend.
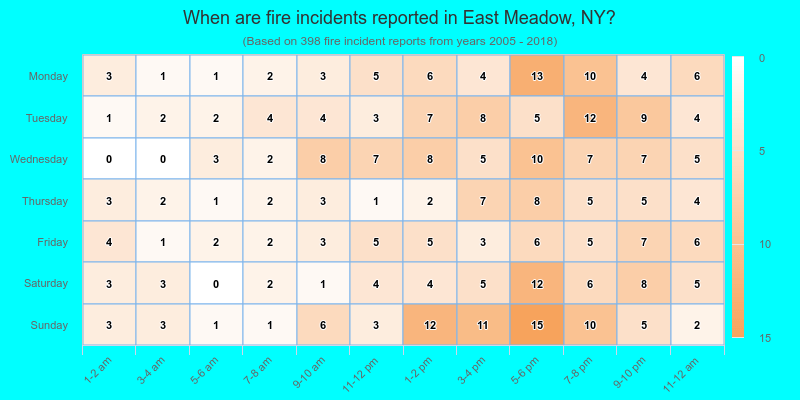
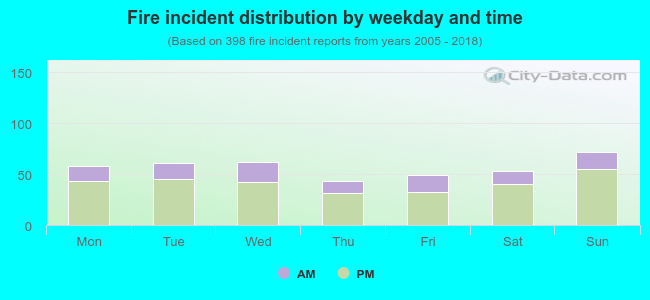 27.6% incidents where reported in the morning and 72.4% in the evening. The most fires (18.1%) took place on Sunday, and the least (10.8%) on Thursday.
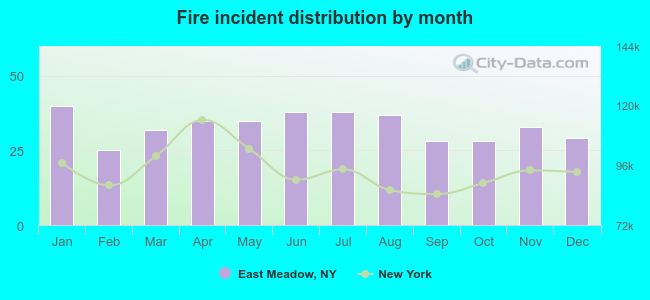 According to the 398 reports from years 2005 - 2018 most fires (10.1%) took place during January, and the least (6.3%) in February.
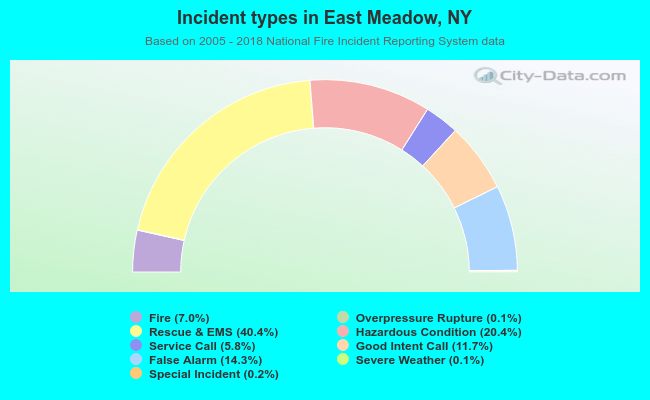 Out of all 5,666 cases reported during the years 2005 - 2018, the most belonged to the categories: Rescue & EMS (40.4%), Hazardous Condition (20.4%), and False Alarm (14.3%).
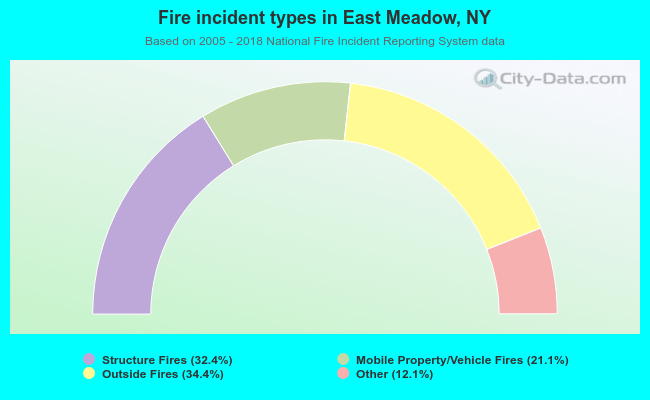 When looking into fire subcategories, the most incidents belonged to: Outside Fires (34.4%), and Structure Fires (32.4%).