Henrietta: Fire Incidents, New York (NY)
Where are fire incidents reported in Henrietta, NY
Something went wrong! Please refresh the page.
|
| |||||||||||||||||||||||||||||||||||||||||||||||||||||||||||||||||||||||||||||||||||||||||||||||||||||||||||||
2004 - 2018 National Fire Incident Reporting System (NFIRS) incidents
- Incident types reported to NFIRS in Henrietta, NY
- 1,67440.8%Rescue & EMS
- 85320.8%Hazardous Condition
- 47311.5%False Alarm
- 45211.0%Good Intent Call
- 3278.0%Fire
- 2967.2%Service Call
- 90.2%Overpressure Rupture
- 90.2%Severe Weather
- 90.2%Special Incident
- Fire incident types reported to NFIRS in Henrietta, NY
- 10431.8%Structure Fires
- 9629.4%Outside Fires
- 9529.1%Mobile Property/Vehicle Fires
- 329.8%Other
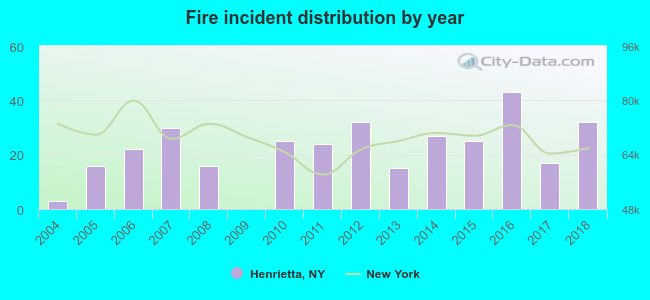 According to the data from the years 2004 - 2018 the average number of fire incidents per year is 22. The highest number of fire incidents - 43 took place in 2016, and the least - 0 in 2009. The data has a growing trend.
The average number of yearly fire incidents per 10k residents in Henrietta, NY compared to nearest cities:
(Note: Based on data for the last 3 years, including only cities with population 5,000 and above)
| Henrietta: | 7.2 |
| Brighton: | 1.6 |
| Mendon: | 12.7 |
| Chili: | 0.7 |
| Rochester: | 93.1 |
| Gates: | 2.6 |
| East Rochester: | 31.3 |
| Perinton: | 2.3 |
| Fairport: | 126.0 |
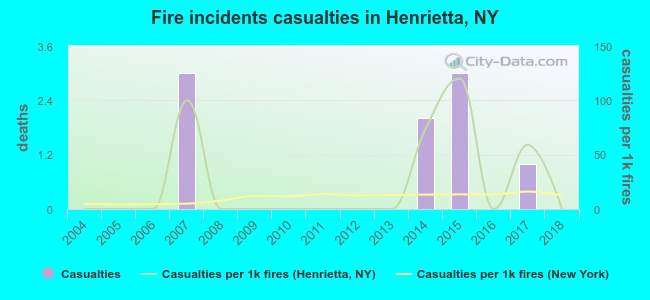 According to the reports from the years 2004 - 2018 the average number of fire-related yearly casualties is 1. The highest number of reported casualties - 3 took place in 2007, and the lowest - 0 in 2004. The data has a constant trend.
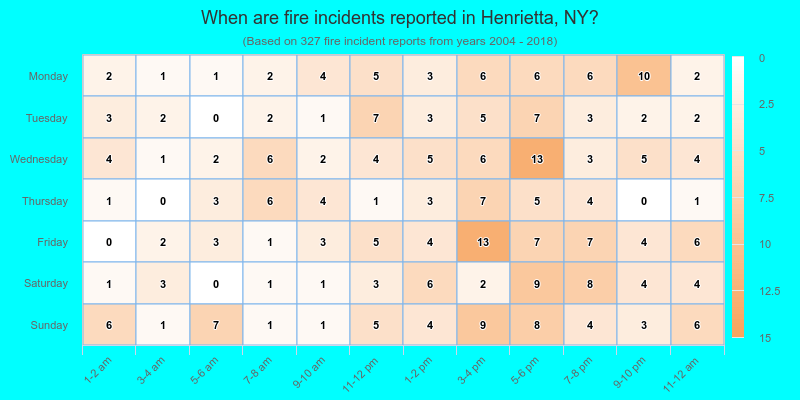
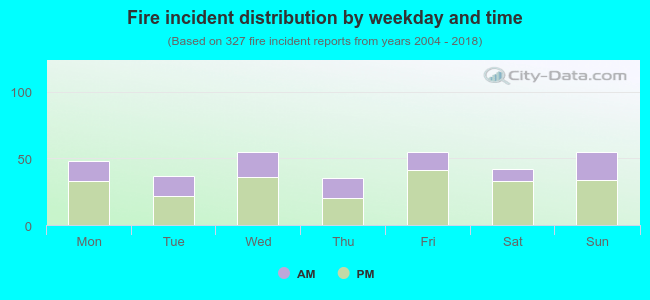 33.0% incidents where reported in the morning and 67.0% in the evening. The most fires (16.8%) took place on Wednesday, and the least (10.7%) on Thursday.
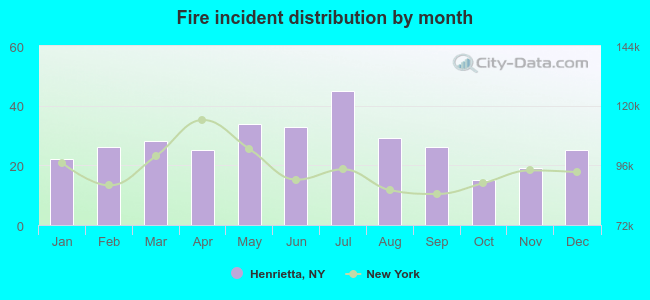 Based on the 327 fire incidents from years 2004 - 2018 most fires (13.8%) took place during July, and the least (4.6%) in October.
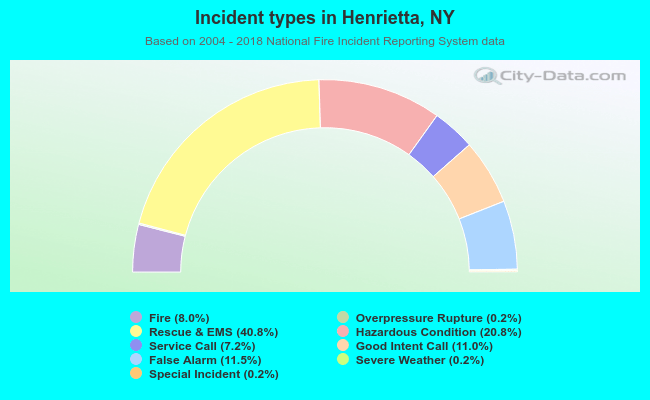 Out of all 4,102 cases reported during the years 2004 - 2018, the most belonged to the categories: Rescue & EMS (40.8%), Hazardous Condition (20.8%), and False Alarm (11.5%).
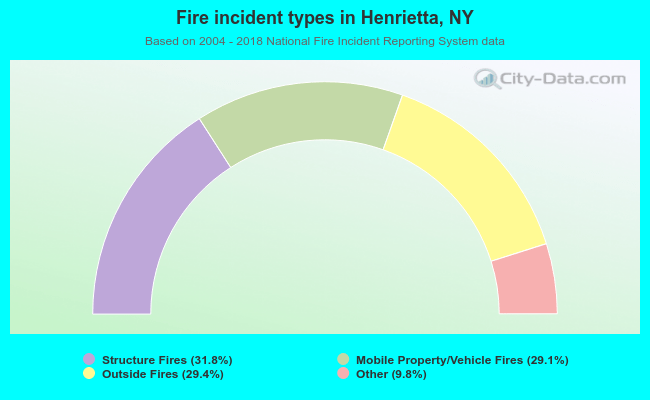 When looking into fire subcategories, the most reports belonged to: Structure Fires (31.8%), and Outside Fires (29.4%).