Rochester: Fire Incidents, New York (NY)
Where are fire incidents reported in Rochester, NY
Something went wrong! Please refresh the page.
| Fire incidents reported | |
|---|---|
| Sreet name | Count |
| LAKE AV | 704 |
| N CLINTON AV | 532 |
| E RIDGE RD | 512 |
| CULVER RD | 498 |
| ST PAUL ST | 494 |
| E MAIN ST | 446 |
| CLIFFORD AV | 430 |
| DEWEY AV | 424 |
| AFFINITY LN | 388 |
| JEFFERSON ROAD | 364 |
| HUDSON AV | 348 |
| LYELL AV | 342 |
| PORTLAND AV | 328 |
| CHILI AV | 312 |
| DEWEY AVE | 312 |
| MONROE AV | 306 |
| N GOODMAN ST | 302 |
| GENESEE ST | 286 |
| W HENRIETTA ROAD | 258 |
| NORTON ST | 256 |
| S CLINTON AV | 256 |
| JOSEPH AV | 252 |
| EAST AV | 248 |
| ALEXANDER ST | 228 |
| SOUTH AV | 226 |
| EMERSON ST | 222 |
| LONG POND RD | 214 |
| CRANBERRY LANDING DR | 210 |
| GARSON AV | 210 |
| JAY ST | 210 |
| Other | 19,123 |
2002 - 2018 National Fire Incident Reporting System (NFIRS) incidents
- Incident types reported to NFIRS in Rochester, NY
- 143,01742.5%Rescue & EMS
- 80,14423.8%Hazardous Condition
- 31,5639.4%False Alarm
- 29,2418.7%Fire
- 20,7746.2%Good Intent Call
- 19,9305.9%Service Call
- 8,3952.5%Special Incident
- 2,6130.8%Overpressure Rupture
- 6840.2%Severe Weather
- Fire incident types reported to NFIRS in Rochester, NY
- 14,53149.7%Structure Fires
- 10,01034.2%Outside Fires
- 3,66712.5%Mobile Property/Vehicle Fires
- 1,0333.5%Other
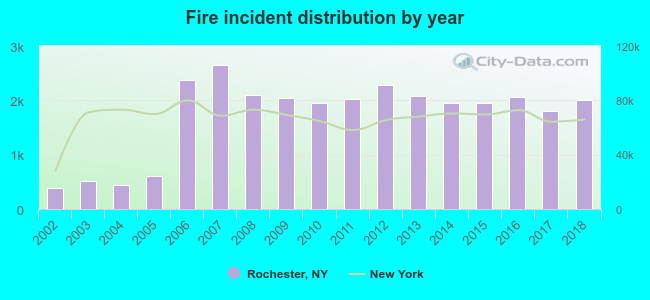 Based on the data from the years 2002 - 2018 the average number of fire incidents per year is 1,720. The highest number of fires - 2,658 took place in 2007, and the least - 391 in 2002. The data has a growing trend.
The average number of yearly fire incidents per 10k residents in Rochester, NY compared to nearest cities:
(Note: Based on data for the last 3 years, including only cities with population 5,000 and above)
| Rochester: | 93.1 |
| Irondequoit: | 10.0 |
| Brighton: | 1.6 |
| Gates: | 2.6 |
| Greece: | 81.3 |
| Henrietta: | 7.2 |
| Penfield: | 21.2 |
| East Rochester: | 31.3 |
| Chili: | 0.7 |
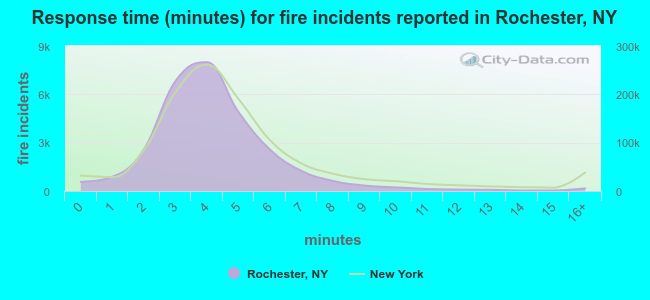 The median response time based on all reported fire incidents is 4 minutes. This is comparable to the state median value.
The median response time in Rochester, NY compared to nearest cities:
(Note: Based on data for all years, including only cities with at least 500 fire incidents)
| Rochester: | 4 minutes |
| Pittsford: | 6 minutes |
| Penfield: | 7 minutes |
| Fairport: | 6 minutes |
| Webster: | 6 minutes |
| Spencerport: | 8 minutes |
| Hilton: | 5 minutes |
| Victor: | 6 minutes |
| Brockport: | 5 minutes |
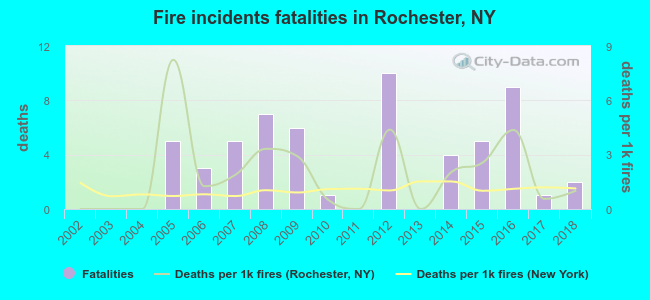 Based on the reports from the years 2002 - 2018 the average number of fire-related fatalities per year is 3. The highest number of deaths - 10 took place in 2012, and the lowest - 0 in 2002. The data has a rising trend.
The average number of fatalities per 1,000 fires is 2. This indicator was the highest - 8 in 2005, and the lowest 0 in 2002. The trend for deaths per 1,000 fire incidents is rising. Compared to the New York value the number of fatalities per 1,000 incidents is higher.
Based on the reports from the years 2002 - 2018 the average number of fire-related fatalities per year is 3. The highest number of deaths - 10 took place in 2012, and the lowest - 0 in 2002. The data has a rising trend.
The average number of fatalities per 1,000 fires is 2. This indicator was the highest - 8 in 2005, and the lowest 0 in 2002. The trend for deaths per 1,000 fire incidents is rising. Compared to the New York value the number of fatalities per 1,000 incidents is higher.Deaths per 1,000 incidents in Rochester, NY compared to nearest cities:
(Note: Based on data for all years, including only cities with at least 2,500 fire incidents)
| Rochester: | 2.0 |
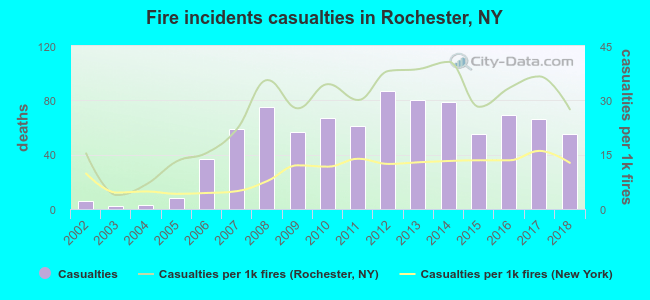 According to the reports from the years 2002 - 2018 the average number of fire-related casualties per year is 51. The highest number of reported casualties - 87 took place in 2012, and the lowest - 2 in 2003. The data has a rising trend.
The average number of injuries per 1,000 fire incidents is 26. This indicator was the highest - 41 in 2014, and the lowest 4 in 2003. The trend for casualties per 1,000 incidents is increasing. Compared to the New York value the number of casualties per 1,000 incidents is much higher.
According to the reports from the years 2002 - 2018 the average number of fire-related casualties per year is 51. The highest number of reported casualties - 87 took place in 2012, and the lowest - 2 in 2003. The data has a rising trend.
The average number of injuries per 1,000 fire incidents is 26. This indicator was the highest - 41 in 2014, and the lowest 4 in 2003. The trend for casualties per 1,000 incidents is increasing. Compared to the New York value the number of casualties per 1,000 incidents is much higher.
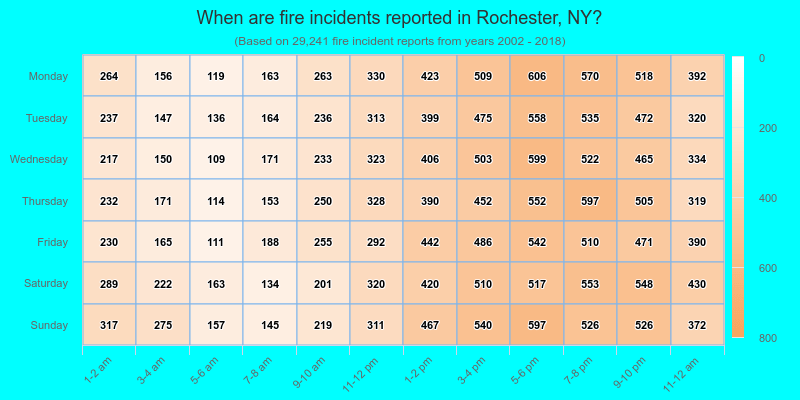
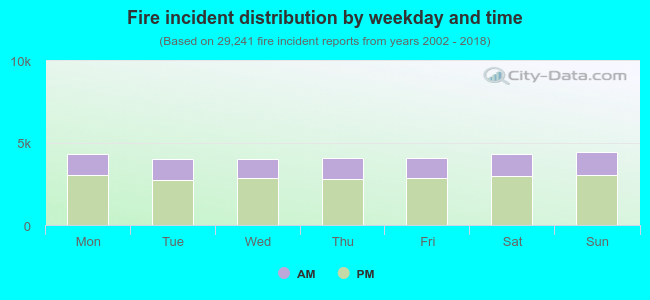 30.7% incidents where reported in the morning and 69.3% in the evening. The most fires (15.2%) took place on Sunday, and the least (13.7%) on Tuesday.
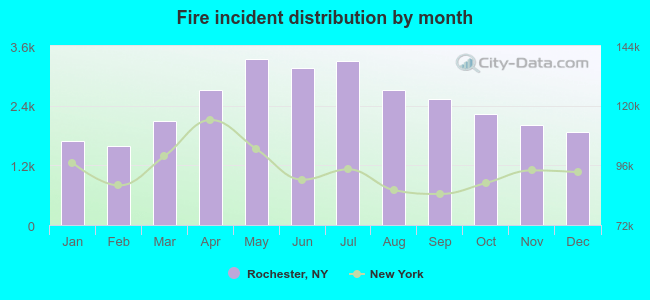 According to the 29,241 reports from years 2002 - 2018 most fires (11.4%) took place during May, and the least (5.4%) in February.
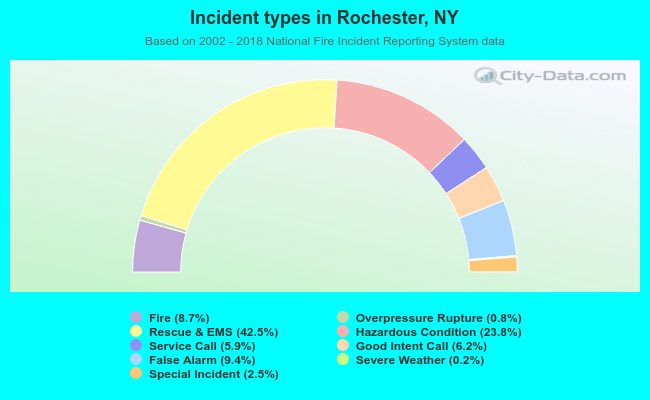 Out of all 336,361 cases reported during the years 2002 - 2018, the most belonged to the categories: Rescue & EMS (42.5%), Hazardous Condition (23.8%), and False Alarm (9.4%).
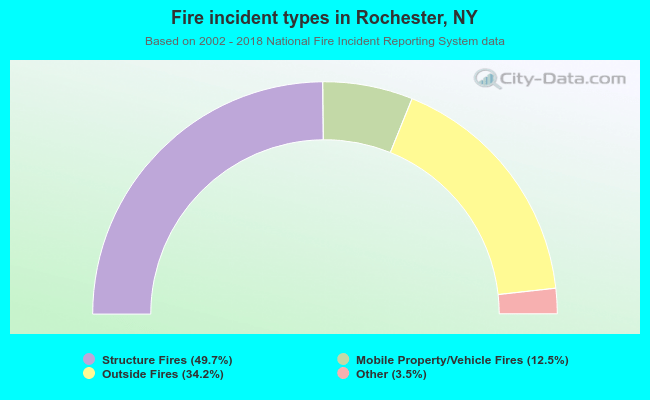 When looking into fire subcategories, the most reports belonged to: Structure Fires (49.7%), and Outside Fires (34.2%).