East Wenatchee: Fire Incidents, Washington (WA)
Where are fire incidents reported in East Wenatchee, WA
Something went wrong! Please refresh the page.
| Fire incidents reported | |
|---|---|
| Sreet name | Count |
| GRANT RD | 176 |
| SUNSET HWY | 116 |
| VALLEY MALL PKY | 106 |
| CASCADE AVE | 92 |
| EASTMONT AVE | 86 |
| BAKER AVE | 78 |
| SR 28 HWY | 74 |
| 3RD ST | 68 |
| ROCK ISLAND RD | 64 |
| 8TH ST | 54 |
| 9TH ST | 52 |
| 10TH ST | 46 |
| HIGHLINE DR | 44 |
| KENTUCKY AVE | 42 |
| 27TH ST | 40 |
| 6TH ST | 40 |
| 5TH ST | 36 |
| 4TH ST | 34 |
| DEVON AVE | 32 |
| 11TH ST | 30 |
| HIGHWAY 28 | 30 |
| HIGHWAY 2/97 | 26 |
| 2ND ST | 22 |
| GEORGIA AVE | 22 |
| 1ST ST | 20 |
| ASHLAND AVE | 20 |
| NILE AVE | 20 |
| SR 28 | 20 |
| US 2 HWY | 20 |
| 7TH ST | 18 |
| Other | 355 |
2002 - 2018 National Fire Incident Reporting System (NFIRS) incidents
- Incident types reported to NFIRS in East Wenatchee, WA
- 3,52945.6%Rescue & EMS
- 1,88324.3%Fire
- 1,00913.0%Good Intent Call
- 5747.4%Hazardous Condition
- 3774.9%Service Call
- 3484.5%False Alarm
- 130.2%Special Incident
- 80.1%Overpressure Rupture
- Fire incident types reported to NFIRS in East Wenatchee, WA
- 89947.7%Outside Fires
- 64434.2%Structure Fires
- 23012.2%Mobile Property/Vehicle Fires
- 1105.8%Other
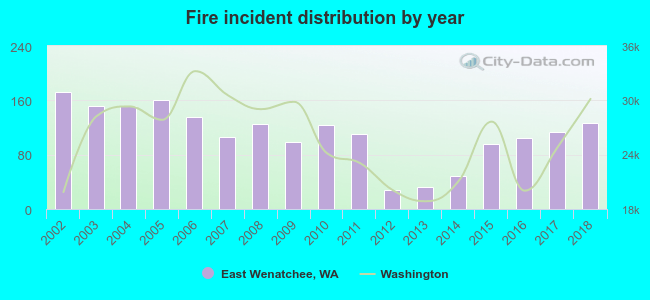 Based on the data from the years 2002 - 2018 the average number of fires per year is 111. The highest number of fire incidents - 173 took place in 2002, and the least - 28 in 2012. The data has a declining trend.
The average number of yearly fire incidents per 10k residents in East Wenatchee, WA compared to nearest cities:
(Note: Based on data for the last 3 years, including only cities with population 5,000 and above)
| East Wenatchee: | 84.9 |
| East Wenatchee Bench: | 1.0 |
| Wenatchee: | 53.0 |
| Quincy: | 126.9 |
| Ellensburg: | 81.5 |
| Ephrata: | 102.5 |
| Moses Lake: | 115.1 |
| Selah: | 100.3 |
| Terrace Heights: | 1.4 |
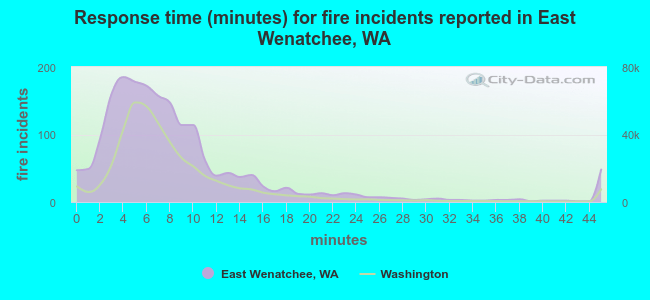 The median response time based on all reported fire incidents is 7 minutes. This is comparable to the Washington median value.
The median response time in East Wenatchee, WA compared to nearest cities:
(Note: Based on data for all years, including only cities with at least 500 fire incidents)
| East Wenatchee: | 7 minutes |
| Wenatchee: | 6 minutes |
| Leavenworth: | 9 minutes |
| Quincy: | 10 minutes |
| Chelan: | 10 minutes |
| Ellensburg: | 10 minutes |
| Cle Elum: | 11 minutes |
| Ephrata: | 10 minutes |
| Soap Lake: | 9 minutes |
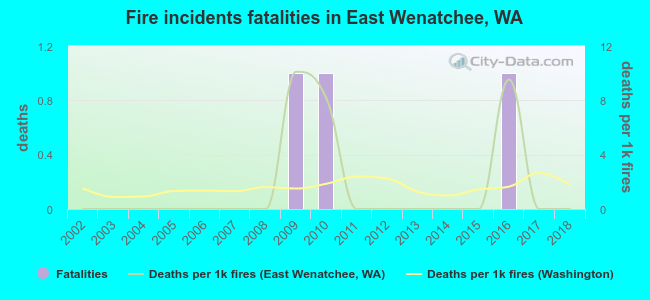 According to the data from the years 2002 - 2018 the average number of fire-related fatalities per year is 0. The highest number of deaths - 1 took place in 2009, and the lowest - 0 in 2002. The data has a constant trend.
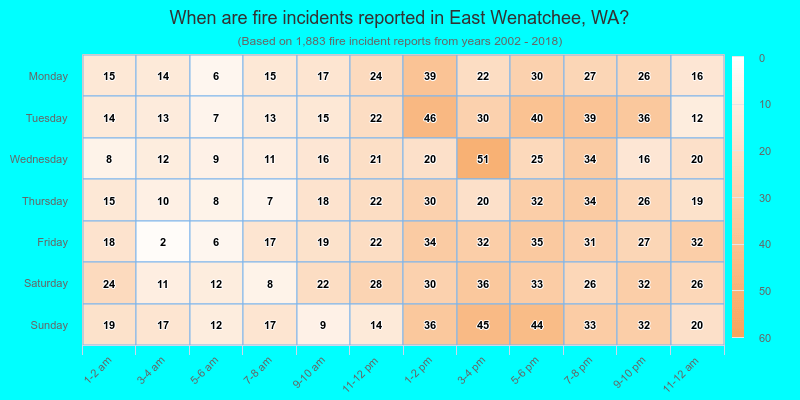
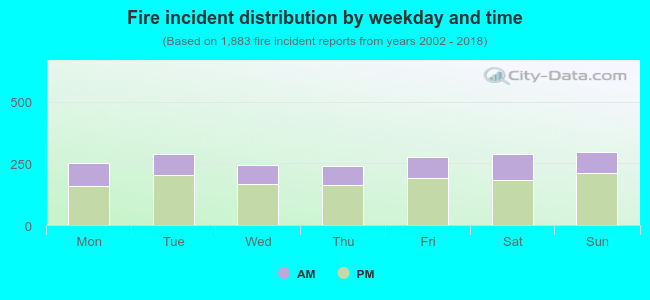 32.3% incidents where reported in the morning and 67.7% in the evening. The most fires (15.8%) took place on Sunday, and the least (12.8%) on Thursday.
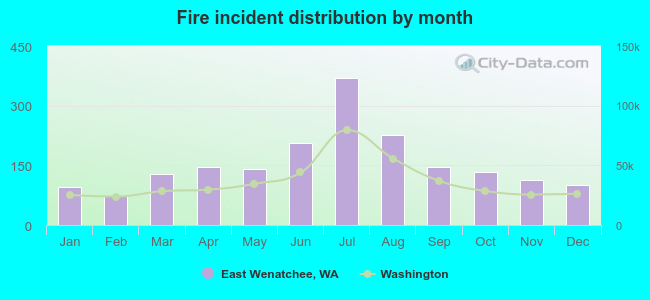 Based on the 1,883 fires from years 2002 - 2018 most fires (19.6%) took place during July, and the least (3.9%) in February.
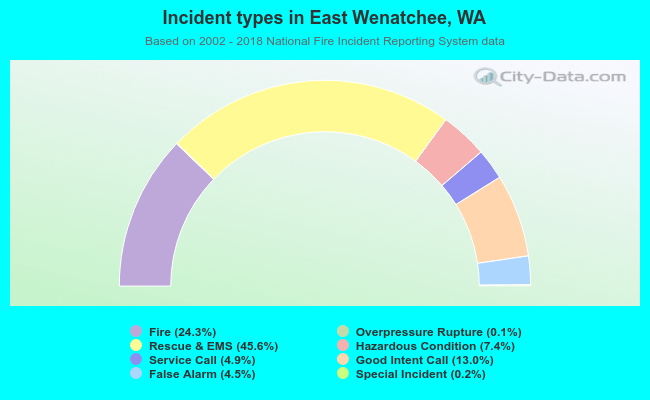 Out of all 7,741 cases reported during the years 2002 - 2018, the most belonged to the categories: Rescue & EMS (45.6%), Fire (24.3%), and Good Intent Call (13.0%).
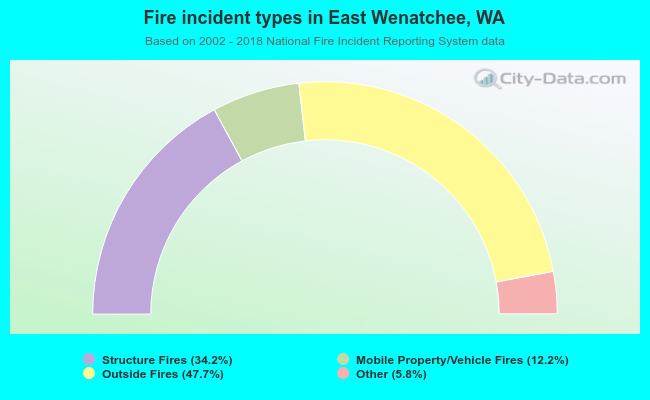 When looking into fire subcategories, the most reports belonged to: Outside Fires (47.7%), and Structure Fires (34.2%).