Wenatchee: Fire Incidents, Washington (WA)
Where are fire incidents reported in Wenatchee, WA
Something went wrong! Please refresh the page.
| Fire incidents reported | |
|---|---|
| Sreet name | Count |
| WENATCHEE AVE | 436 |
| MILLER ST | 142 |
| MISSION ST | 140 |
| METHOW ST | 132 |
| CHELAN AVE | 120 |
| EASY ST | 90 |
| COLUMBIA ST | 86 |
| MISSION | 84 |
| SQUILCHUCK RD | 82 |
| OKANOGAN AVE | 72 |
| WESTERN AVE | 58 |
| BOODRY ST | 54 |
| MALAGA ALCOA HWY | 54 |
| US 97A | 52 |
| MCKITTRICK ST | 48 |
| NINTH ST | 46 |
| WALLA WALLA AVE | 46 |
| MALAGA AVE | 44 |
| CASCADE ST | 42 |
| EMERSON AVE | 42 |
| LOWER MONITOR RD | 42 |
| FIFTH ST | 40 |
| KITTITAS ST | 40 |
| OLDS STATION RD | 40 |
| SPRINGWATER AVE | 40 |
| WENATCHEE | 40 |
| MAPLE ST | 38 |
| SKYLINE DR | 38 |
| WALKER AVE | 38 |
| CHELAN | 36 |
| Other | 1,274 |
2002 - 2018 National Fire Incident Reporting System (NFIRS) incidents
- Incident types reported to NFIRS in Wenatchee, WA
- 8,64248.3%Rescue & EMS
- 3,53619.8%Fire
- 1,87110.5%Good Intent Call
- 1,3337.4%Hazardous Condition
- 1,2316.9%False Alarm
- 1,0886.1%Service Call
- 1440.8%Special Incident
- 420.2%Overpressure Rupture
- Fire incident types reported to NFIRS in Wenatchee, WA
- 1,60745.4%Structure Fires
- 1,30737.0%Outside Fires
- 45712.9%Mobile Property/Vehicle Fires
- 1654.7%Other
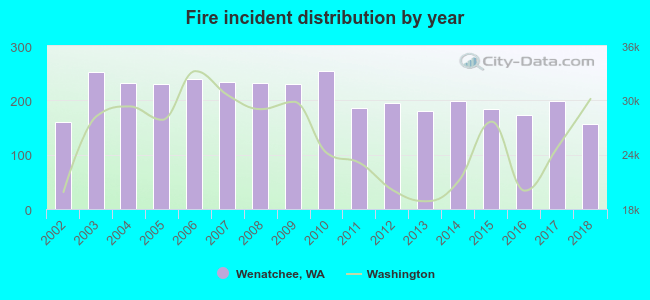 Based on the data from the years 2002 - 2018 the average number of fires per year is 208. The highest number of fires - 254 took place in 2010, and the least - 157 in 2018. The data has a decreasing trend.
The average number of yearly fire incidents per 10k residents in Wenatchee, WA compared to nearest cities:
(Note: Based on data for the last 3 years, including only cities with population 5,000 and above)
| Wenatchee: | 53.0 |
| East Wenatchee: | 84.9 |
| East Wenatchee Bench: | 1.0 |
| Quincy: | 126.9 |
| Ellensburg: | 81.5 |
| Ephrata: | 102.5 |
| Moses Lake: | 115.1 |
| Selah: | 100.3 |
| Terrace Heights: | 1.4 |
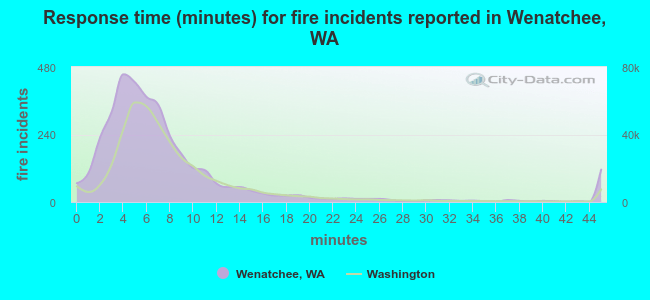 The median response time based on all reported fire incidents is 6 minutes. This is similar to the state median value.
The median response time in Wenatchee, WA compared to nearest cities:
(Note: Based on data for all years, including only cities with at least 500 fire incidents)
| Wenatchee: | 6 minutes |
| East Wenatchee: | 7 minutes |
| Leavenworth: | 9 minutes |
| Quincy: | 10 minutes |
| Ellensburg: | 10 minutes |
| Chelan: | 10 minutes |
| Cle Elum: | 11 minutes |
| Ephrata: | 10 minutes |
| Soap Lake: | 9 minutes |
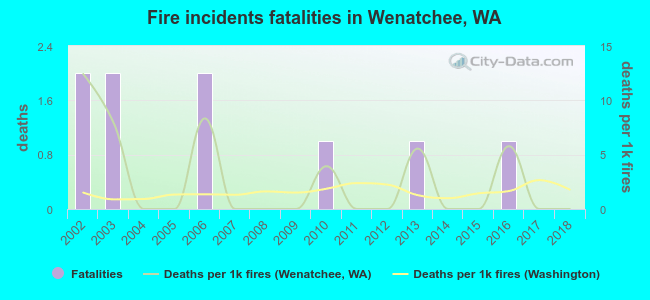 According to the reports from the years 2002 - 2018 the average number of fire-related yearly deaths is 1. The highest number of reported deaths - 2 took place in 2002, and the lowest - 0 in 2004. The data has a dropping trend.
The average number of fatalities per 1,000 fires is 3. This indicator was the highest - 12 in 2002, and the lowest 0 in 2004. The trend for deaths per 1,000 fire incidents is decreasing. Compared to the state value the number of fatalities per 1,000 incidents is higher.
According to the reports from the years 2002 - 2018 the average number of fire-related yearly deaths is 1. The highest number of reported deaths - 2 took place in 2002, and the lowest - 0 in 2004. The data has a dropping trend.
The average number of fatalities per 1,000 fires is 3. This indicator was the highest - 12 in 2002, and the lowest 0 in 2004. The trend for deaths per 1,000 fire incidents is decreasing. Compared to the state value the number of fatalities per 1,000 incidents is higher.Deaths per 1,000 incidents in Wenatchee, WA compared to nearest cities:
(Note: Based on data for all years, including only cities with at least 2,500 fire incidents)
| Wenatchee: | 2.5 |
| Moses Lake: | 1.9 |
| Yakima: | 1.2 |
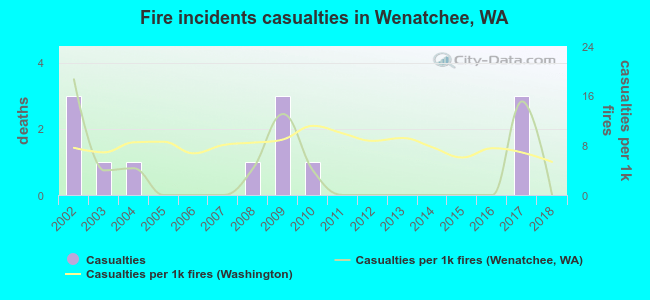 According to the reports from the years 2002 - 2018 the average number of fire-related yearly casualties is 1. The highest number of reported casualties - 3 took place in 2002, and the lowest - 0 in 2005. The data has a declining trend.
The average number of injuries per 1,000 fires is 4. This indicator was the highest - 19 in 2002, and the lowest 0 in 2005. The trend for casualties per 1,000 fire incidents is decreasing. Compared to the Washington value the number of casualties per 1,000 fires is much lower.
According to the reports from the years 2002 - 2018 the average number of fire-related yearly casualties is 1. The highest number of reported casualties - 3 took place in 2002, and the lowest - 0 in 2005. The data has a declining trend.
The average number of injuries per 1,000 fires is 4. This indicator was the highest - 19 in 2002, and the lowest 0 in 2005. The trend for casualties per 1,000 fire incidents is decreasing. Compared to the Washington value the number of casualties per 1,000 fires is much lower.Casualties per 1,000 incidents in Wenatchee, WA compared to nearest cities:
(Note: Based on data for all years, including only cities with at least 500 fire incidents)
| Wenatchee: | 3.7 |
| East Wenatchee: | 0.5 |
| Leavenworth: | 4.8 |
| Quincy: | 0.5 |
| Ellensburg: | 4.1 |
| Chelan: | 4.4 |
| Cle Elum: | 2.5 |
| Ephrata: | 0.8 |
| Soap Lake: | 4.8 |
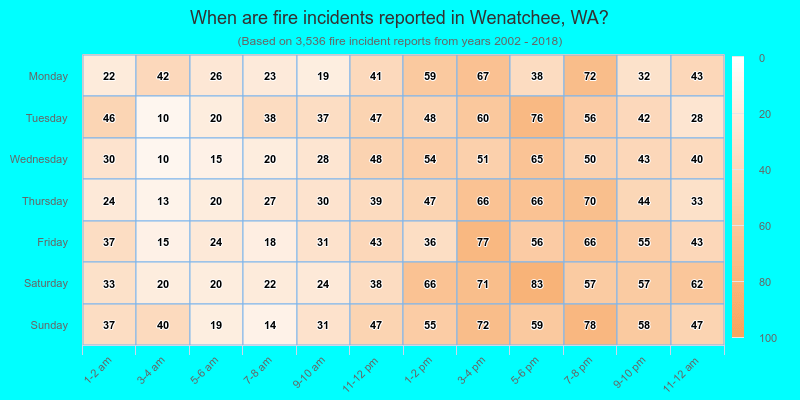
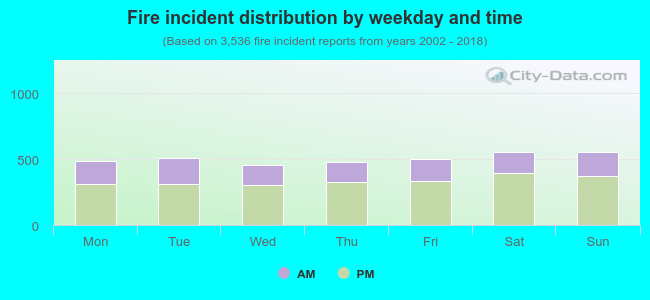 33.6% incidents where reported in the morning and 66.4% in the evening. The most fires (15.8%) took place on Sunday, and the least (12.8%) on Wednesday.
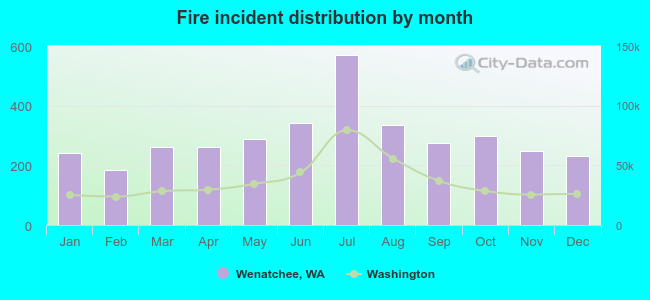 According to the 3,536 fire incident reports from years 2002 - 2018 most fires (16.1%) took place during July, and the least (5.2%) in February.
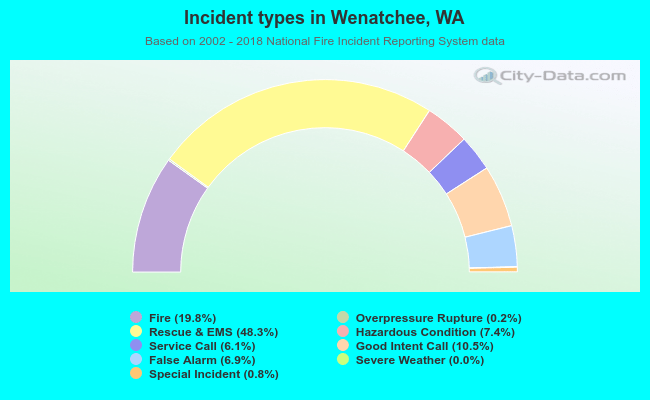 Out of all 17,895 cases reported during the years 2002 - 2018, the most belonged to the categories: Rescue & EMS (48.3%), Fire (19.8%), and Good Intent Call (10.5%).
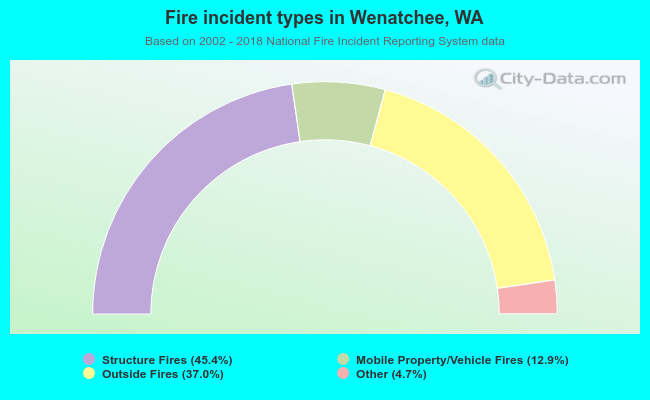 When looking into fire subcategories, the most incidents belonged to: Structure Fires (45.4%), and Outside Fires (37.0%).