Ellensburg: Fire Incidents, Washington (WA)
Where are fire incidents reported in Ellensburg, WA
Something went wrong! Please refresh the page.
| Fire incidents reported | |
|---|---|
| Sreet name | Count |
| VANTAGE HWY | 134 |
| CANYON RD | 126 |
| UMPTANUM RD | 84 |
| I90 | 78 |
| WILSON CREEK RD | 72 |
| I90 FWY | 68 |
| UNIVERSITY WAY | 68 |
| REECER CREEK RD | 62 |
| MANASTASH RD | 58 |
| WALNUT ST | 54 |
| I-90 FWY | 52 |
| ALDER ST | 50 |
| I-90 | 50 |
| MOUNTAIN VIEW AVE | 50 |
| CHESTNUT ST | 46 |
| PEARL ST | 46 |
| RUBY ST | 46 |
| 11TH AVE | 44 |
| PINE ST | 42 |
| WATER ST | 42 |
| PARKE CREEK RD | 38 |
| TJOSSEM RD | 38 |
| 3RD AVE | 34 |
| 5TH AVE | 34 |
| KITTITAS HWY | 34 |
| THORP HWY | 34 |
| I82 | 32 |
| 14TH AVE | 30 |
| DRY CREEK RD | 30 |
| MAIN ST | 30 |
| Other | 837 |
2002 - 2018 National Fire Incident Reporting System (NFIRS) incidents
- Incident types reported to NFIRS in Ellensburg, WA
- 12,06565.9%Rescue & EMS
- 2,44313.3%Fire
- 1,1336.2%Hazardous Condition
- 1,0485.7%Good Intent Call
- 8974.9%False Alarm
- 5893.2%Service Call
- 1100.6%Special Incident
- 220.1%Overpressure Rupture
- Fire incident types reported to NFIRS in Ellensburg, WA
- 1,26651.8%Outside Fires
- 70728.9%Structure Fires
- 42017.2%Mobile Property/Vehicle Fires
- 502.0%Other
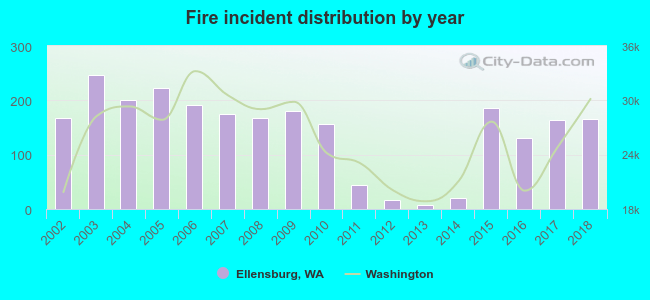 According to the data from the years 2002 - 2018 the average number of fires per year is 144. The highest number of reported fire incidents - 246 took place in 2003, and the least - 8 in 2013. The data has a dropping trend.
The average number of yearly fire incidents per 10k residents in Ellensburg, WA compared to nearest cities:
(Note: Based on data for the last 3 years, including only cities with population 5,000 and above)
| Ellensburg: | 81.5 |
| Selah: | 100.3 |
| Terrace Heights: | 1.4 |
| West Valley: | 1.4 |
| Yakima: | 69.6 |
| Union Gap: | 61.4 |
| Wenatchee: | 53.0 |
| East Wenatchee Bench: | 1.0 |
| East Wenatchee: | 84.9 |
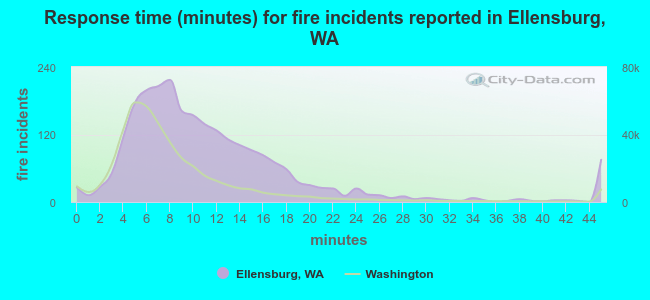 The median response time based on all reported fire incidents is 10 minutes. This is higher compared to the Washington median value.
The median response time in Ellensburg, WA compared to nearest cities:
(Note: Based on data for all years, including only cities with at least 500 fire incidents)
| Ellensburg: | 10 minutes |
| Naches: | 16 minutes |
| Cle Elum: | 11 minutes |
| Selah: | 11 minutes |
| Yakima: | 7 minutes |
| Union Gap: | 7 minutes |
| Wenatchee: | 6 minutes |
| Moxee: | 10 minutes |
| East Wenatchee: | 7 minutes |
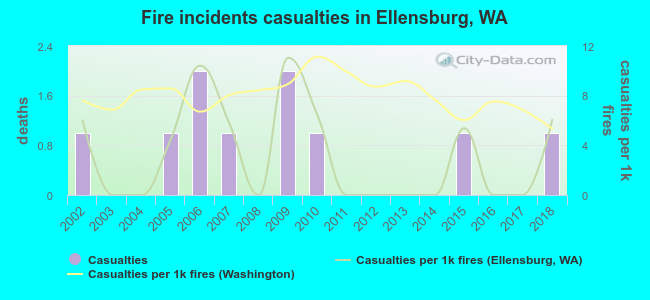 Based on the data from the years 2002 - 2018 the average number of fire-related casualties per year is 1. The highest number of reported casualties - 2 took place in 2006, and the lowest - 0 in 2003. The data has a constant trend.
The average number of injuries per 1,000 fire incidents is 3. This indicator was the highest - 11 in 2009, and the lowest 0 in 2003. The trend for casualties per 1,000 fire incidents is rising. Compared to the Washington value the number of injuries per 1,000 fire incidents is lower.
Based on the data from the years 2002 - 2018 the average number of fire-related casualties per year is 1. The highest number of reported casualties - 2 took place in 2006, and the lowest - 0 in 2003. The data has a constant trend.
The average number of injuries per 1,000 fire incidents is 3. This indicator was the highest - 11 in 2009, and the lowest 0 in 2003. The trend for casualties per 1,000 fire incidents is rising. Compared to the Washington value the number of injuries per 1,000 fire incidents is lower.
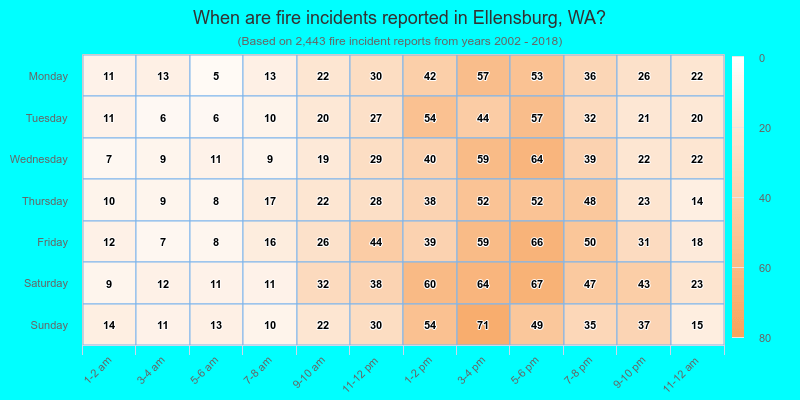
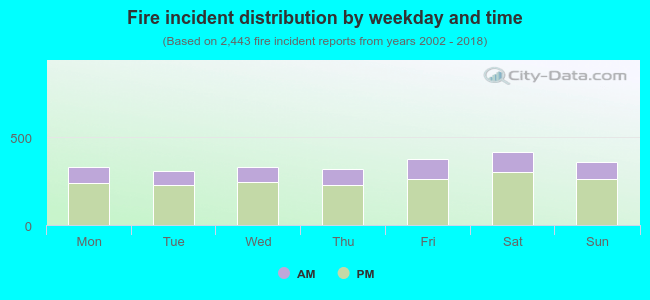 27.8% incidents where reported in the morning and 72.2% in the evening. The most fires (17.1%) took place on Saturday, and the least (12.6%) on Tuesday.
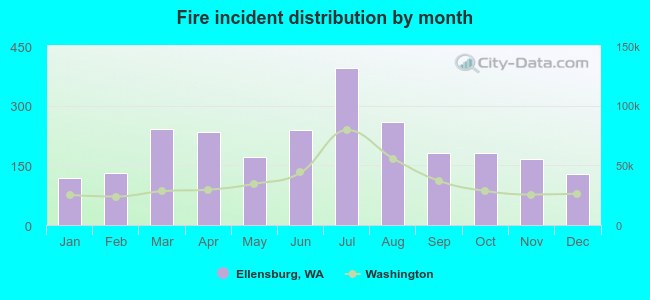 Based on the 2,443 fire incidents from years 2002 - 2018 most fires (16.2%) took place during July, and the least (4.8%) in January.
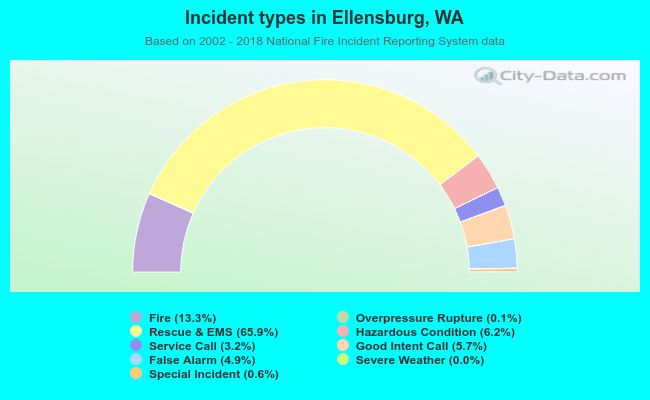 Out of all 18,309 cases reported during the years 2002 - 2018, the most belonged to the categories: Rescue & EMS (65.9%), Fire (13.3%), and Hazardous Condition (6.2%).
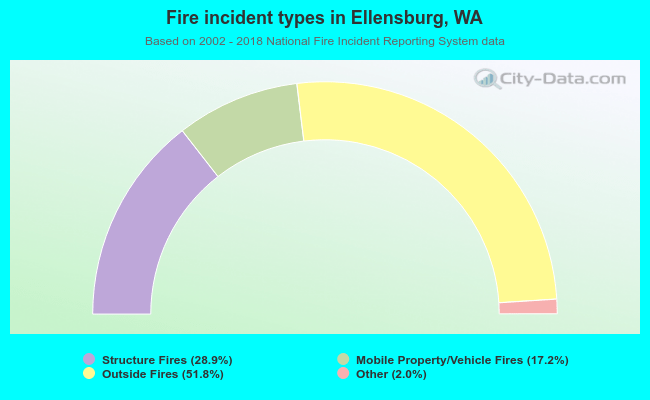 When looking into fire subcategories, the most reports belonged to: Outside Fires (51.8%), and Structure Fires (28.9%).