Elkhart: Fire Incidents, Indiana (IN)
Where are fire incidents reported in Elkhart, IN
Something went wrong! Please refresh the page.
| Fire incidents reported | |
|---|---|
| Sreet name | Count |
| MAIN ST | 204 |
| BRISTOL ST | 126 |
| CASSOPOLIS ST | 120 |
| INDIANA AVE | 118 |
| MIDDLEBURY ST | 112 |
| HIVELY AVE | 110 |
| COUNTY RD 20 | 102 |
| LEXINGTON AVE | 98 |
| LUSHER AVE | 98 |
| COUNTY ROAD 6 RD | 92 |
| COUNTY ROAD 4 RD | 88 |
| COUNTY ROAD 9 RD | 84 |
| COUNTY RD 13 | 78 |
| TOLEDO RD | 76 |
| 6TH ST | 68 |
| JACKSON BLVD | 66 |
| NORTH PARK AVE | 66 |
| US 33 | 66 |
| OAKLAND AVE | 62 |
| PRAIRIE ST | 62 |
| FRANKLIN ST | 60 |
| GARFIELD AVE | 60 |
| BEARDSLEY AVE | 58 |
| WOLF AVE | 58 |
| COUNTY RD 26 | 56 |
| COUNTY RD 45 | 52 |
| OLD US 20 HWY | 52 |
| STATE ROAD 19 RD | 50 |
| OLD US 33 | 48 |
| PLEASANT PLAIN AVE | 48 |
| Other | 3,225 |
2002 - 2017 National Fire Incident Reporting System (NFIRS) incidents
- Incident types reported to NFIRS in Elkhart, IN
- 6,86637.0%Rescue & EMS
- 5,66330.5%Fire
- 2,88115.5%Hazardous Condition
- 1,2016.5%False Alarm
- 1,0995.9%Good Intent Call
- 7364.0%Service Call
- 560.3%Special Incident
- 310.2%Severe Weather
- Fire incident types reported to NFIRS in Elkhart, IN
- 2,55945.2%Outside Fires
- 1,95534.5%Structure Fires
- 74713.2%Mobile Property/Vehicle Fires
- 4027.1%Other
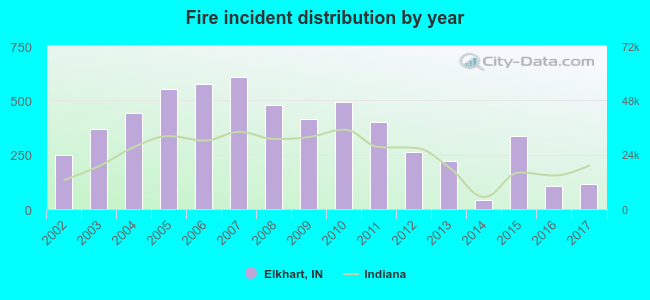 Based on the data from the years 2002 - 2017 the average number of fires per year is 354. The highest number of fire incidents - 609 took place in 2007, and the least - 43 in 2014. The data has a declining trend.
The average number of yearly fire incidents per 10k residents in Elkhart, IN compared to nearest cities:
(Note: Based on data for the last 3 years, including only cities with population 5,000 and above)
| Elkhart: | 14.4 |
| Goshen: | 26.1 |
| Granger: | 15.5 |
| Mishawaka: | 21.9 |
| Notre Dame: | 36.8 |
| South Bend: | 26.3 |
| Nappanee: | 37.2 |
| Plymouth: | 24.4 |
| Warsaw: | 55.3 |
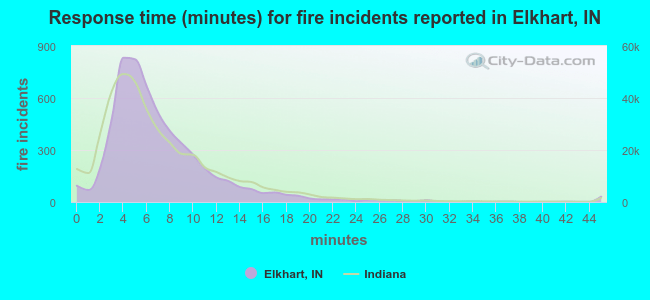 The median response time based on all reported fire incidents is 6 minutes. This is close to the state median value.
The median response time in Elkhart, IN compared to nearest cities:
(Note: Based on data for all years, including only cities with at least 500 fire incidents)
| Elkhart: | 6 minutes |
| Osceola: | 9 minutes |
| Goshen: | 6 minutes |
| Granger: | 6 minutes |
| Mishawaka: | 5 minutes |
| Middlebury: | 8 minutes |
| Notre Dame: | 2 minutes |
| South Bend: | 5 minutes |
| Nappanee: | 6 minutes |
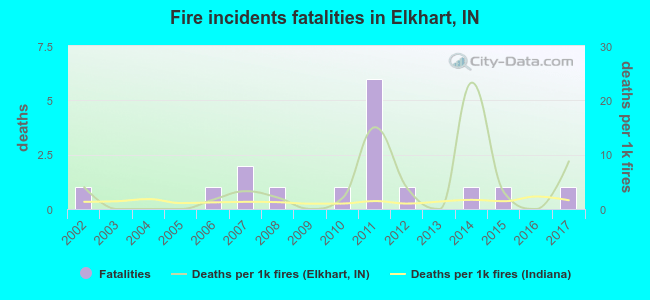 Based on the data from the years 2002 - 2017 the average number of fire-related fatalities per year is 1. The highest number of deaths - 6 took place in 2011, and the lowest - 0 in 2003. The data has a constant trend.
The average number of deaths per 1,000 fire incidents is 4. This indicator was the highest - 23 in 2014, and the lowest 0 in 2003. The trend for fatalities per 1,000 incidents is rising. Compared to the Indiana value the number of fatalities per 1,000 fires is much higher.
Based on the data from the years 2002 - 2017 the average number of fire-related fatalities per year is 1. The highest number of deaths - 6 took place in 2011, and the lowest - 0 in 2003. The data has a constant trend.
The average number of deaths per 1,000 fire incidents is 4. This indicator was the highest - 23 in 2014, and the lowest 0 in 2003. The trend for fatalities per 1,000 incidents is rising. Compared to the Indiana value the number of fatalities per 1,000 fires is much higher.Deaths per 1,000 incidents in Elkhart, IN compared to nearest cities:
(Note: Based on data for all years, including only cities with at least 2,500 fire incidents)
| Elkhart: | 2.8 |
| Goshen: | 0.0 |
| South Bend: | 0.6 |
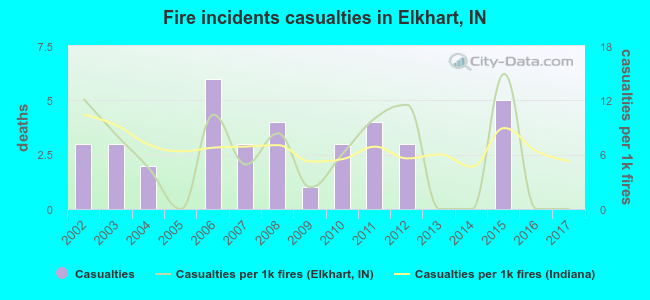 According to the reports from the years 2002 - 2017 the average number of fire-related casualties per year is 2. The highest number of casualties - 6 took place in 2006, and the lowest - 0 in 2005. The data has a declining trend.
The average number of injuries per 1,000 fires is 6. This indicator was the highest - 15 in 2015, and the lowest 0 in 2005. The trend for casualties per 1,000 incidents is dropping. Compared to the Indiana value the number of casualties per 1,000 fire incidents is about the same.
According to the reports from the years 2002 - 2017 the average number of fire-related casualties per year is 2. The highest number of casualties - 6 took place in 2006, and the lowest - 0 in 2005. The data has a declining trend.
The average number of injuries per 1,000 fires is 6. This indicator was the highest - 15 in 2015, and the lowest 0 in 2005. The trend for casualties per 1,000 incidents is dropping. Compared to the Indiana value the number of casualties per 1,000 fire incidents is about the same.Casualties per 1,000 incidents in Elkhart, IN compared to nearest cities:
(Note: Based on data for all years, including only cities with at least 500 fire incidents)
| Elkhart: | 6.5 |
| Osceola: | 2.9 |
| Goshen: | 7.3 |
| Granger: | 18.5 |
| Mishawaka: | 11.4 |
| Middlebury: | 7.9 |
| Notre Dame: | 14.6 |
| South Bend: | 2.2 |
| Nappanee: | 18.1 |
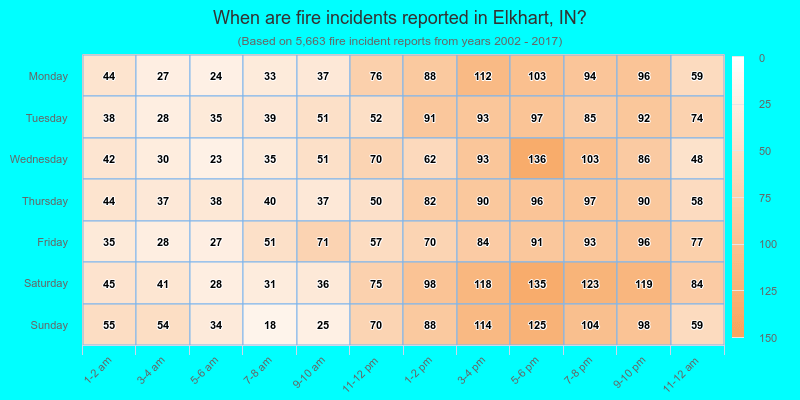
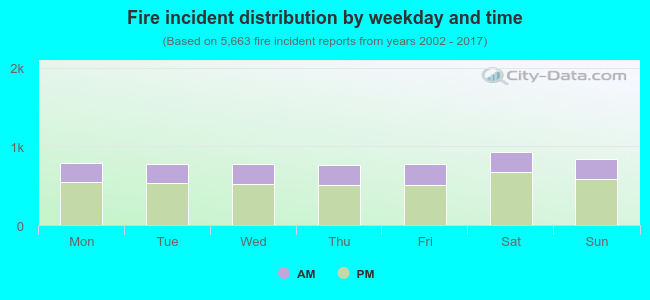 31.1% incidents where reported in the morning and 68.9% in the evening. The most fires (16.5%) took place on Saturday, and the least (13.4%) on Thursday.
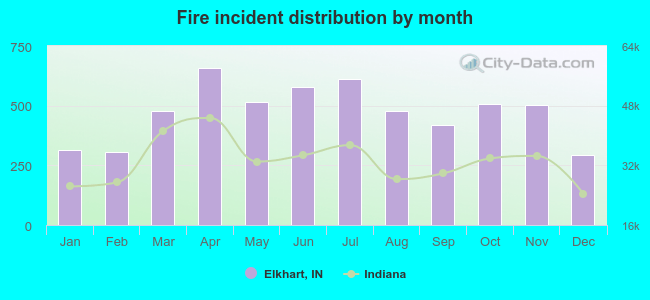 According to the 5,663 incident reports from years 2002 - 2017 most fires (11.6%) took place during April, and the least (5.2%) in December.
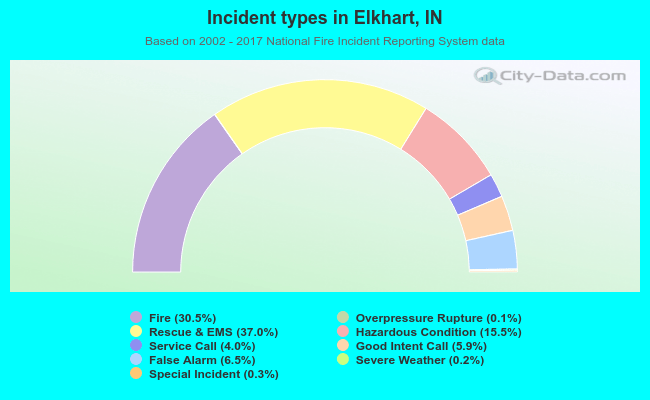 Out of all 18,549 cases reported during the years 2002 - 2017, the most belonged to the categories: Rescue & EMS (37.0%), Fire (30.5%), and Hazardous Condition (15.5%).
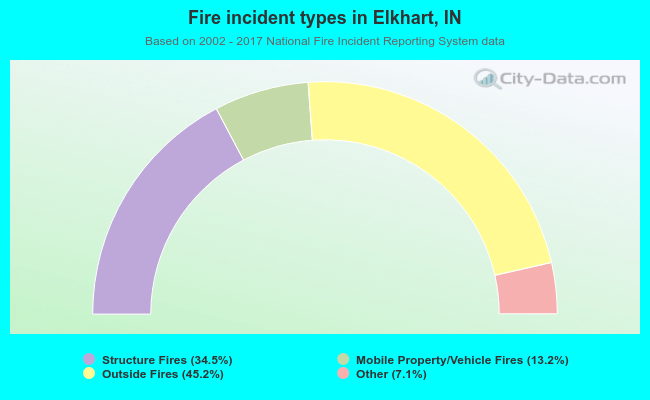 When looking into fire subcategories, the most reports belonged to: Outside Fires (45.2%), and Structure Fires (34.5%).