Plymouth: Fire Incidents, Indiana (IN)
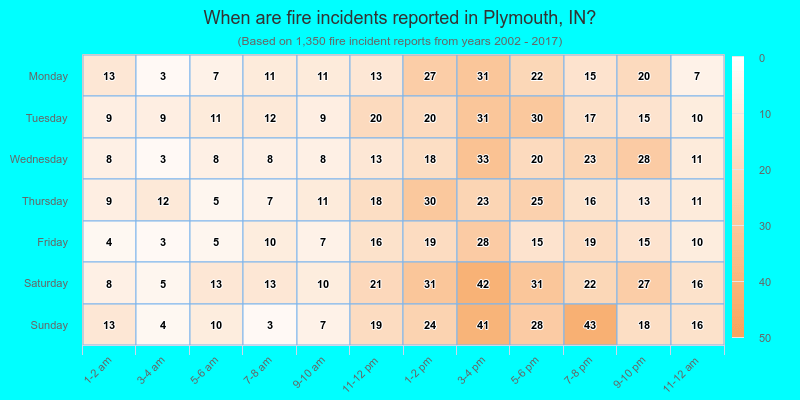
Where are fire incidents reported in Plymouth, IN
Something went wrong! Please refresh the page.
|
| |||||||||||||||||||||||||||||||||||||||||||||||||||||||||||||||||||||||||||||||||||||||||||||||||||||||||||||
2002 - 2017 National Fire Incident Reporting System (NFIRS) incidents
- Incident types reported to NFIRS in Plymouth, IN
- 1,65240.6%Rescue & EMS
- 1,35033.2%Fire
- 53013.0%Hazardous Condition
- 2456.0%Good Intent Call
- 2145.3%False Alarm
- 481.2%Service Call
- 190.5%Severe Weather
- 50.1%Special Incident
- Fire incident types reported to NFIRS in Plymouth, IN
- 54240.1%Structure Fires
- 53739.8%Outside Fires
- 22516.7%Mobile Property/Vehicle Fires
- 463.4%Other
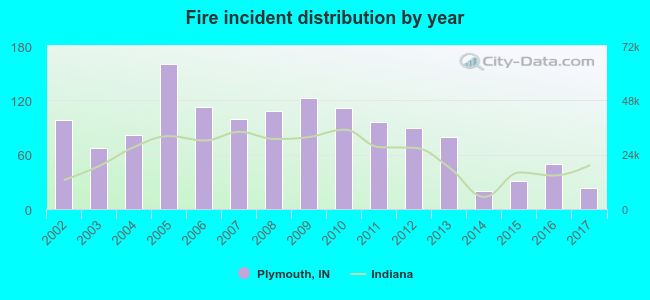 According to the data from the years 2002 - 2017 the average number of fires per year is 84. The highest number of reported fire incidents - 160 took place in 2005, and the least - 20 in 2014. The data has a declining trend.
The average number of yearly fire incidents per 10k residents in Plymouth, IN compared to nearest cities:
(Note: Based on data for the last 3 years, including only cities with population 5,000 and above)
| Plymouth: | 24.4 |
| Nappanee: | 37.2 |
| Rochester: | 82.8 |
| South Bend: | 26.3 |
| Mishawaka: | 21.9 |
| Notre Dame: | 36.8 |
| Warsaw: | 55.3 |
| La Porte: | 21.5 |
| Granger: | 15.5 |
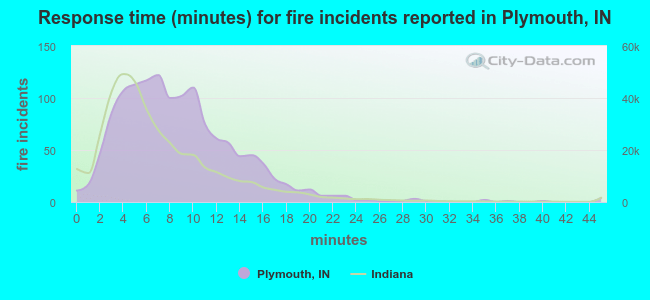 The median response time based on all reported fire incidents is 8 minutes. This is higher than the state median value.
The median response time in Plymouth, IN compared to nearest cities:
(Note: Based on data for all years, including only cities with at least 500 fire incidents)
| Plymouth: | 8 minutes |
| Walkerton: | 8 minutes |
| Knox: | 7 minutes |
| Nappanee: | 6 minutes |
| Rochester: | 8 minutes |
| South Bend: | 5 minutes |
| Mishawaka: | 5 minutes |
| Notre Dame: | 2 minutes |
| Warsaw: | 5 minutes |
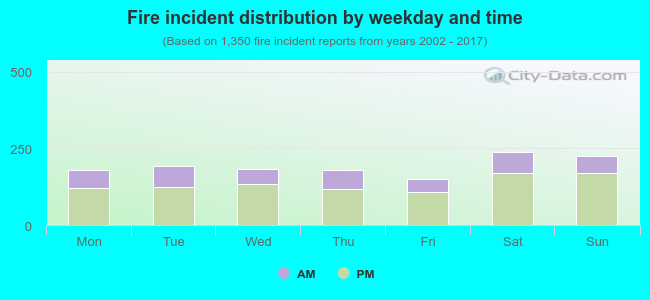 30.3% incidents where reported in the morning and 69.7% in the evening. The most fires (17.7%) took place on Saturday, and the least (11.2%) on Friday.
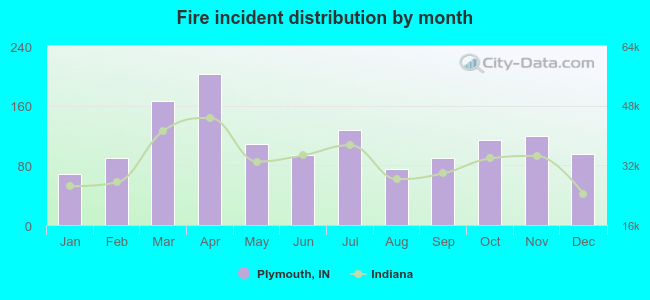 Based on the 1,350 incident reports from years 2002 - 2017 most fires (15.0%) took place during April, and the least (5.0%) in January.
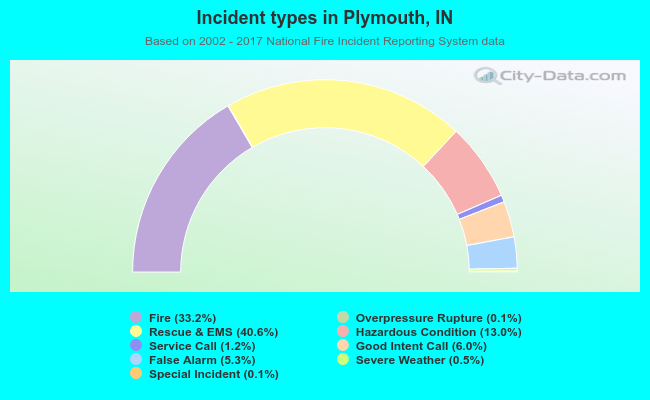 Out of all 4,067 cases reported during the years 2002 - 2017, the most belonged to the categories: Rescue & EMS (40.6%), Fire (33.2%), and Hazardous Condition (13.0%).
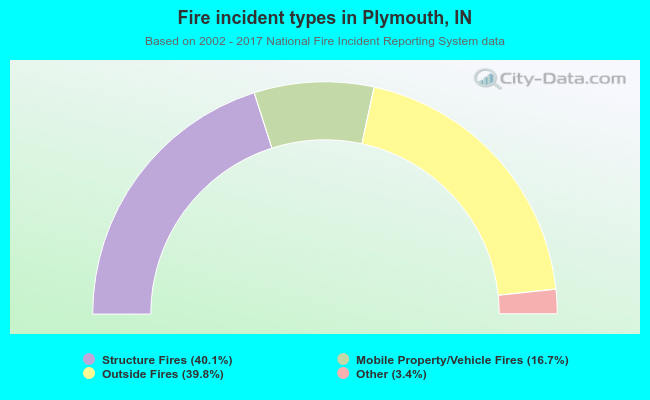 When looking into fire subcategories, the most incidents belonged to: Structure Fires (40.1%), and Outside Fires (39.8%).