Granger: Fire Incidents, Indiana (IN)
Where are fire incidents reported in Granger, IN
Something went wrong! Please refresh the page.
| Fire incidents reported | |
|---|---|
| Sreet name | Count |
| STATE ROAD 23 | 74 |
| ADAMS RD | 54 |
| CLEVELAND RD | 38 |
| ANDERSON RD | 30 |
| ASH RD | 30 |
| FIR RD | 30 |
| BITTERSWEET RD | 28 |
| BRICK RD | 26 |
| DOUGLAS RD | 26 |
| CAPITAL AVE | 20 |
| INTERSTATE 8090 | 20 |
| BUCKEYE RD | 16 |
| GRAPE RD | 16 |
| GUMWOOD RD | 16 |
| HAMILTON | 16 |
| CURRANT RD | 14 |
| BEECH RD | 12 |
| HERBERT ST | 12 |
| CAMPFIRE DR | 10 |
| CHERRY RD | 10 |
| HICKORY | 10 |
| INDIANA TOLL RD | 10 |
| SANDY DR | 10 |
| ST RD 23 | 10 |
| STATE ROAD ??23 | 10 |
| BAYWOOD LN | 8 |
| CLOVER TRL | 8 |
| DARDEN | 8 |
| HICKORY RD | 8 |
| JODIE LYNN DR | 8 |
| Other | 168 |
2002 - 2018 National Fire Incident Reporting System (NFIRS) incidents
- Incident types reported to NFIRS in Granger, IN
- 3,68852.8%Rescue & EMS
- 91213.0%Hazardous Condition
- 75610.8%Fire
- 5738.2%Good Intent Call
- 5568.0%False Alarm
- 4856.9%Service Call
- 70.1%Severe Weather
- 70.1%Special Incident
- Fire incident types reported to NFIRS in Granger, IN
- 33544.3%Structure Fires
- 29639.2%Outside Fires
- 9813.0%Mobile Property/Vehicle Fires
- 273.6%Other
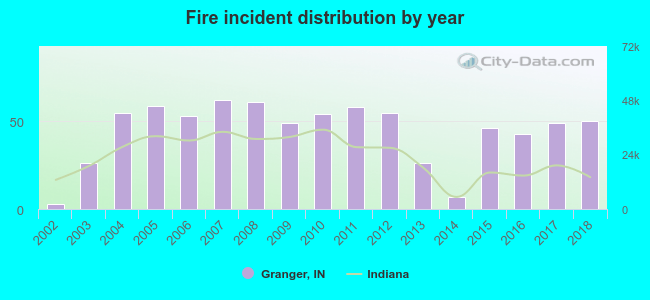 Based on the data from the years 2002 - 2018 the average number of fire incidents per year is 44. The highest number of fires - 62 took place in 2007, and the least - 3 in 2002. The data has an increasing trend.
The average number of yearly fire incidents per 10k residents in Granger, IN compared to nearest cities:
(Note: Based on data for the last 3 years, including only cities with population 5,000 and above)
| Granger: | 15.5 |
| Mishawaka: | 21.9 |
| Notre Dame: | 36.8 |
| South Bend: | 26.3 |
| Elkhart: | 14.4 |
| Goshen: | 26.1 |
| Nappanee: | 37.2 |
| Plymouth: | 24.4 |
| La Porte: | 21.5 |
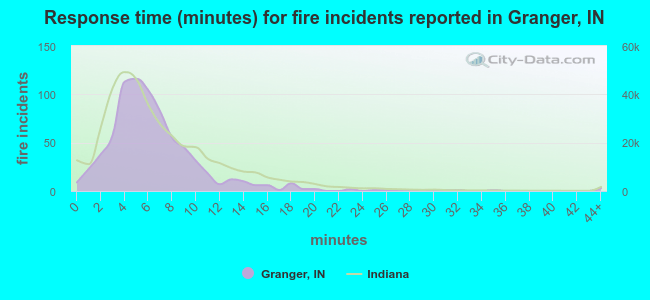 The median response time based on all reported fire incidents is 6 minutes. This is similar to the Indiana median value.
The median response time in Granger, IN compared to nearest cities:
(Note: Based on data for all years, including only cities with at least 500 fire incidents)
| Granger: | 6 minutes |
| Mishawaka: | 5 minutes |
| Notre Dame: | 2 minutes |
| Osceola: | 9 minutes |
| South Bend: | 5 minutes |
| Elkhart: | 6 minutes |
| Goshen: | 6 minutes |
| Nappanee: | 6 minutes |
| Middlebury: | 8 minutes |
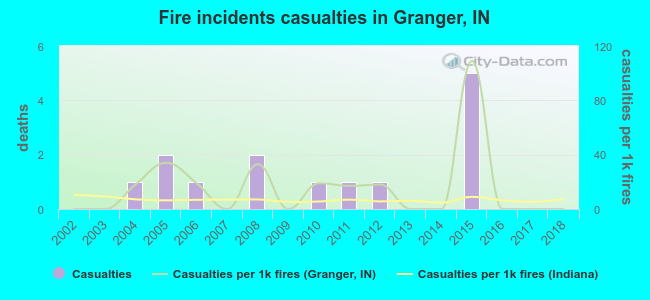 According to the reports from the years 2002 - 2018 the average number of fire-related casualties per year is 1. The highest number of reported casualties - 5 took place in 2015, and the lowest - 0 in 2002. The data has a constant trend.
The average number of casualties per 1,000 fire incidents is 16. This indicator was the highest - 109 in 2015, and the lowest 0 in 2002. The trend for casualties per 1,000 fires is constant. Compared to the state value the number of casualties per 1,000 fire incidents is much higher.
According to the reports from the years 2002 - 2018 the average number of fire-related casualties per year is 1. The highest number of reported casualties - 5 took place in 2015, and the lowest - 0 in 2002. The data has a constant trend.
The average number of casualties per 1,000 fire incidents is 16. This indicator was the highest - 109 in 2015, and the lowest 0 in 2002. The trend for casualties per 1,000 fires is constant. Compared to the state value the number of casualties per 1,000 fire incidents is much higher.Casualties per 1,000 incidents in Granger, IN compared to nearest cities:
(Note: Based on data for all years, including only cities with at least 500 fire incidents)
| Granger: | 18.5 |
| Mishawaka: | 11.4 |
| Notre Dame: | 14.6 |
| Osceola: | 2.9 |
| South Bend: | 2.2 |
| Elkhart: | 6.5 |
| Goshen: | 7.3 |
| Nappanee: | 18.1 |
| Middlebury: | 7.9 |
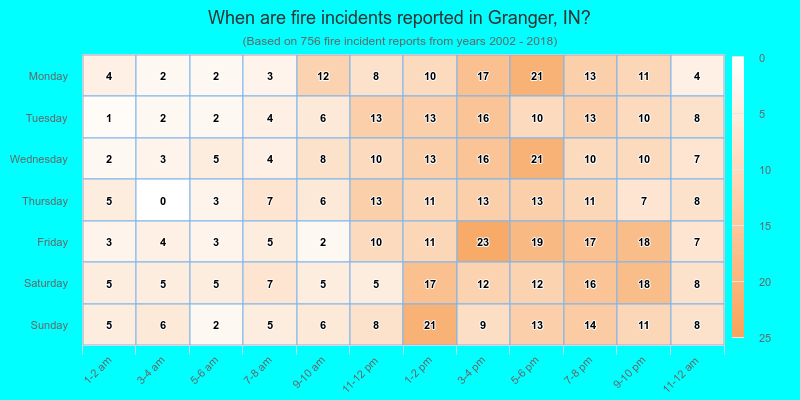
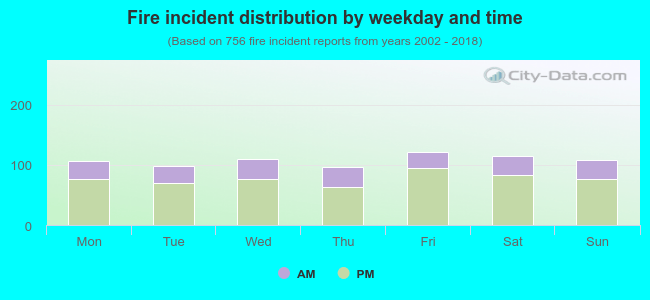 28.6% incidents where reported in the morning and 71.4% in the evening. The most fires (16.1%) took place on Friday, and the least (12.8%) on Thursday.
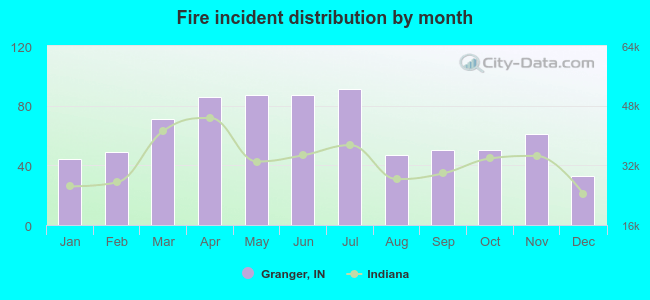 Based on the 756 reports from years 2002 - 2018 most fires (12.0%) took place during July, and the least (4.4%) in December.
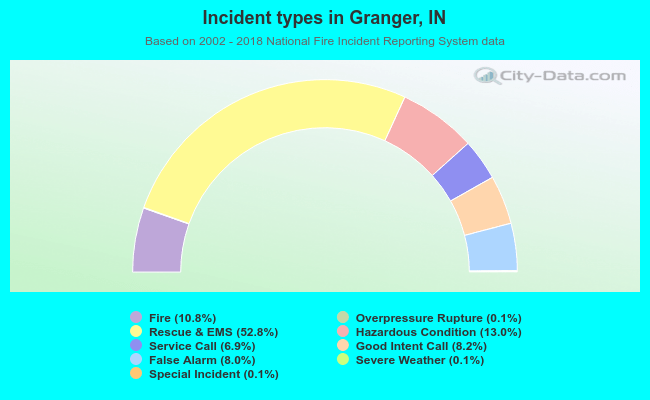 Out of all 6,990 cases reported during the years 2002 - 2018, the most belonged to the categories: Rescue & EMS (52.8%), Hazardous Condition (13.0%), and Fire (10.8%).
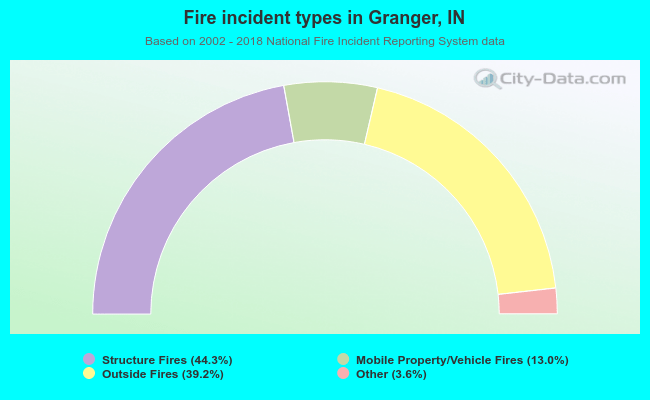 When looking into fire subcategories, the most reports belonged to: Structure Fires (44.3%), and Outside Fires (39.2%).