Ephrata: Fire Incidents, Pennsylvania (PA)
Where are fire incidents reported in Ephrata, PA
Something went wrong! Please refresh the page.
| Fire incidents reported | |
|---|---|
| Sreet name | Count |
| MAIN ST | 200 |
| MAIN ST | 108 |
| STATE ST | 90 |
| STATE ST | 86 |
| READING RD | 68 |
| DIVISION HWY | 44 |
| 222 | 42 |
| FARMERSVILLE RD | 42 |
| OREGON PIKE | 38 |
| BURKHOLDER DR | 34 |
| READING RD | 32 |
| CHURCH AVE | 30 |
| BETHANY RD | 28 |
| FULTON ST | 28 |
| CHURCH ST | 24 |
| FAIRMOUNT RD | 24 |
| WASHINGTON AVE | 24 |
| CHURCH AVE | 22 |
| COCALICO CREEK RD | 22 |
| MARTIN AVE | 22 |
| POOL RD | 22 |
| HACKMAN RD | 20 |
| LINCOLN HEIGHTS AVE | 20 |
| MAPLE ST | 20 |
| METZLER RD | 20 |
| MOHLER CHURCH RD | 20 |
| CLAY RD | 18 |
| LOCUST ST | 18 |
| MEADOW VALLEY RD | 18 |
| RT 222 | 18 |
| Other | 268 |
2002 - 2018 National Fire Incident Reporting System (NFIRS) incidents
- Incident types reported to NFIRS in Ephrata, PA
- 1,47031.2%Fire
- 1,28227.2%Hazardous Condition
- 4549.6%Rescue & EMS
- 3978.4%False Alarm
- 3878.2%Service Call
- 3868.2%Good Intent Call
- 2936.2%Special Incident
- 310.7%Severe Weather
- 130.3%Overpressure Rupture
- Fire incident types reported to NFIRS in Ephrata, PA
- 90761.7%Structure Fires
- 32722.2%Outside Fires
- 1459.9%Mobile Property/Vehicle Fires
- 916.2%Other
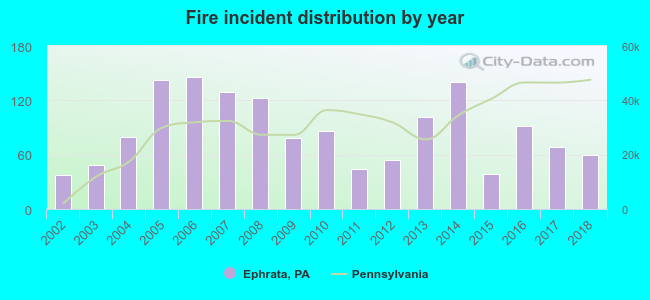 According to the data from the years 2002 - 2018 the average number of fires per year is 86. The highest number of fires - 146 took place in 2006, and the least - 38 in 2002. The data has a growing trend.
The average number of yearly fire incidents per 10k residents in Ephrata, PA compared to nearest cities:
(Note: Based on data for the last 3 years, including only cities with population 5,000 and above)
| Ephrata: | 53.0 |
| Lititz: | 50.4 |
| New Holland: | 72.6 |
| Lancaster: | 100.2 |
| Shillington: | 50.7 |
| Willow Street: | 31.7 |
| Millersville: | 27.5 |
| Wyomissing: | 48.1 |
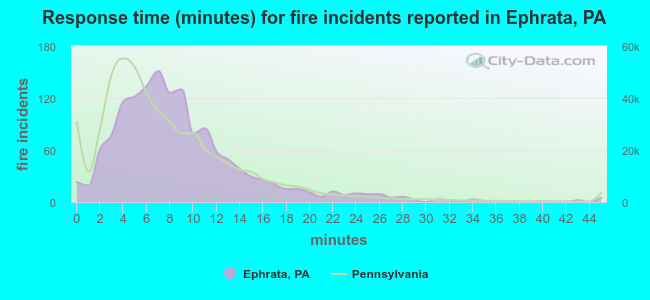 The median response time based on all reported fire incidents is 8 minutes. This is higher than the Pennsylvania median value.
The median response time in Ephrata, PA compared to nearest cities:
(Note: Based on data for all years, including only cities with at least 500 fire incidents)
| Ephrata: | 8 minutes |
| Denver: | 9 minutes |
| Lititz: | 9 minutes |
| New Holland: | 7 minutes |
| Manheim: | 10 minutes |
| Lancaster: | 7 minutes |
| Paradise: | 7 minutes |
| Mohnton: | 9 minutes |
| Sinking Spring: | 6 minutes |
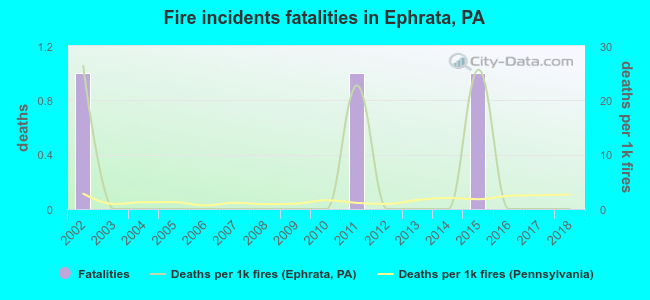 According to the reports from the years 2002 - 2018 the average number of fire-related yearly deaths is 0. The highest number of reported deaths - 1 took place in 2002, and the lowest - 0 in 2003. The data has a declining trend.
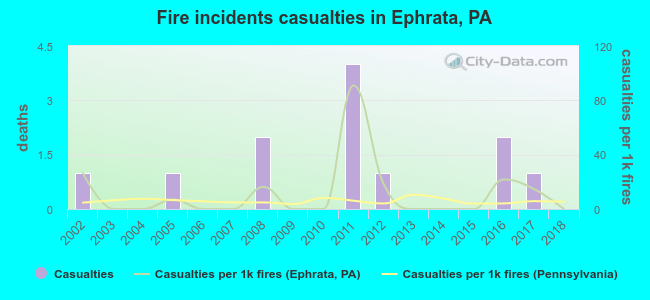 According to the data from the years 2002 - 2018 the average number of fire-related yearly casualties is 1. The highest number of reported casualties - 4 took place in 2011, and the lowest - 0 in 2003. The data has a declining trend.
The average number of injuries per 1,000 fire incidents is 11. This indicator was the highest - 91 in 2011, and the lowest 0 in 2003. The trend for injuries per 1,000 fires is decreasing. Compared to the state value the number of casualties per 1,000 fire incidents is higher.
According to the data from the years 2002 - 2018 the average number of fire-related yearly casualties is 1. The highest number of reported casualties - 4 took place in 2011, and the lowest - 0 in 2003. The data has a declining trend.
The average number of injuries per 1,000 fire incidents is 11. This indicator was the highest - 91 in 2011, and the lowest 0 in 2003. The trend for injuries per 1,000 fires is decreasing. Compared to the state value the number of casualties per 1,000 fire incidents is higher.Casualties per 1,000 incidents in Ephrata, PA compared to nearest cities:
(Note: Based on data for all years, including only cities with at least 500 fire incidents)
| Ephrata: | 8.2 |
| Denver: | 0.9 |
| Lititz: | 2.7 |
| New Holland: | 0.0 |
| Manheim: | 3.5 |
| Lancaster: | 5.3 |
| Paradise: | 0.0 |
| Mohnton: | 2.8 |
| Sinking Spring: | 2.9 |
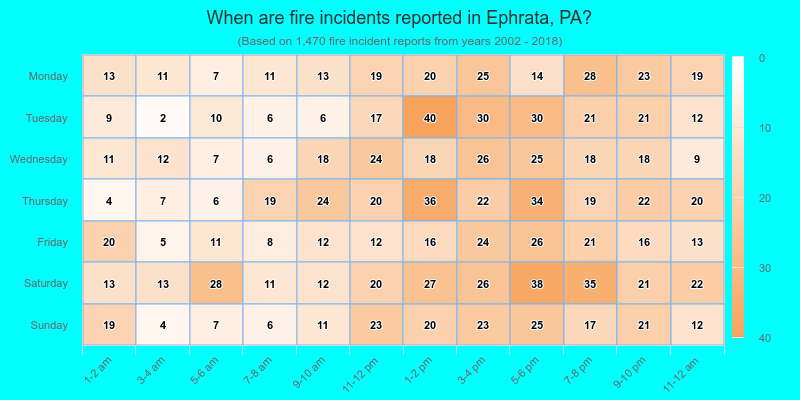
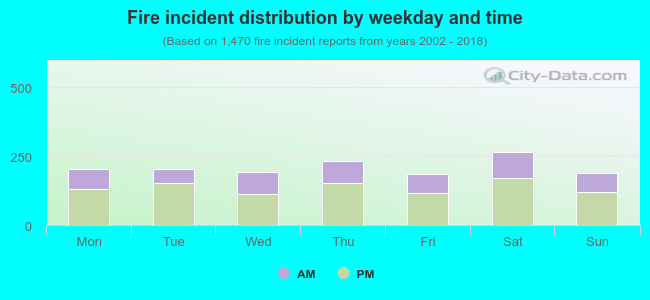 35.2% incidents where reported in the morning and 64.8% in the evening. The most fires (18.1%) took place on Saturday, and the least (12.5%) on Friday.
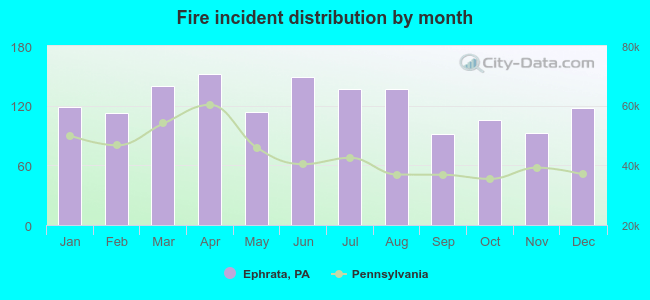 According to the 1,470 reports from years 2002 - 2018 most fires (10.3%) took place during April, and the least (6.3%) in September.
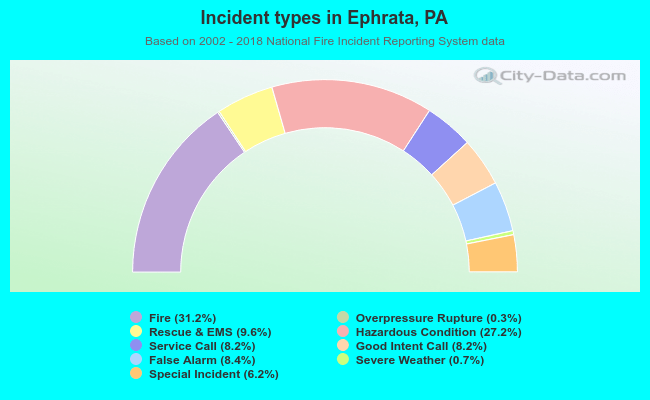 Out of all 4,713 cases reported during the years 2002 - 2018, the most belonged to the categories: Fire (31.2%), Hazardous Condition (27.2%), and Rescue & EMS (9.6%).
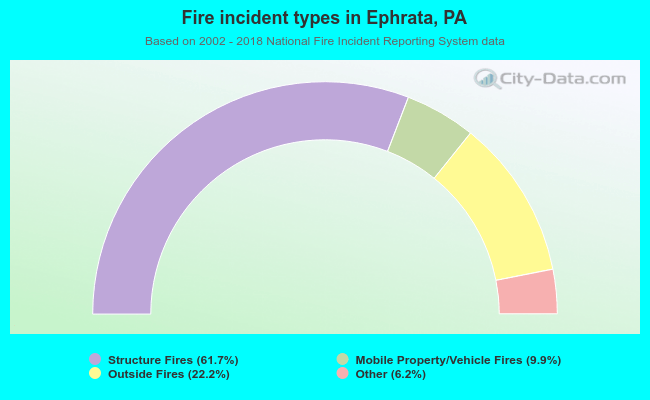 When looking into fire subcategories, the most incidents belonged to: Structure Fires (61.7%), and Outside Fires (22.2%).