Kenton: Fire Incidents, Ohio (OH)
Where are fire incidents reported in Kenton, OH
Something went wrong! Please refresh the page.
| Fire incidents reported | |
|---|---|
| Sreet name | Count |
| MAIN ST | 70 |
| COLUMBUS ST | 60 |
| DETROIT ST | 50 |
| LEIGHTON ST | 38 |
| NORTH ST | 38 |
| ROBINSON AVE | 38 |
| FRANKLIN ST | 36 |
| 68 RT | 34 |
| WAYNE ST | 34 |
| MARKET ST | 32 |
| SR 67 | 30 |
| FOREST RD | 22 |
| LIMA ST | 22 |
| WALNUT ST | 22 |
| SR 309 | 20 |
| STATE ROUTE 309 | 20 |
| STATE ROUTE 67 RT | 20 |
| COUNTY ROAD 135 | 18 |
| ESPY ST | 18 |
| KING ST | 18 |
| 67 RT | 16 |
| CHERRY ST | 16 |
| STATE ROUTE 31 | 16 |
| STATE ROUTE 68 | 16 |
| US 68 | 16 |
| CARROL ST | 14 |
| COUNTY ROAD 195 | 14 |
| CR 144 | 14 |
| CR 190 | 14 |
| SR 31 | 14 |
| Other | 621 |
2002 - 2018 National Fire Incident Reporting System (NFIRS) incidents
- Incident types reported to NFIRS in Kenton, OH
- 1,41136.2%Fire
- 87022.3%Hazardous Condition
- 65216.7%Rescue & EMS
- 44411.4%Service Call
- 2917.5%Good Intent Call
- 1914.9%False Alarm
- 260.7%Special Incident
- 100.3%Overpressure Rupture
- 40.1%Severe Weather
- Fire incident types reported to NFIRS in Kenton, OH
- 73752.2%Structure Fires
- 46633.0%Outside Fires
- 20314.4%Mobile Property/Vehicle Fires
- 50.4%Other
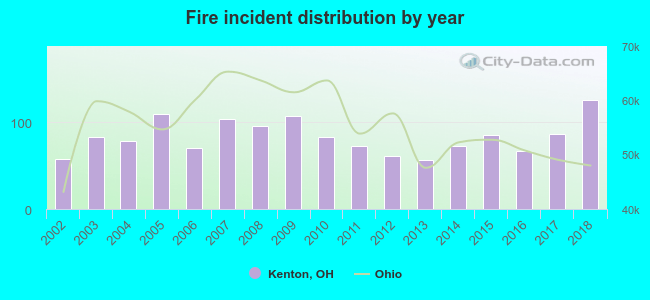 According to the data from the years 2002 - 2018 the average number of fires per year is 83. The highest number of reported fires - 125 took place in 2018, and the least - 56 in 2013. The data has an increasing trend.
The average number of yearly fire incidents per 10k residents in Kenton, OH compared to nearest cities:
(Note: Based on data for the last 3 years, including only cities with population 5,000 and above)
| Kenton: | 112.4 |
| Ada: | 49.7 |
| Bellefontaine: | 44.8 |
| Upper Sandusky: | 82.3 |
| Marion: | 69.5 |
| Lima: | 90.6 |
| Findlay: | 28.9 |
| Wapakoneta: | 66.9 |
| Marysville: | 39.6 |
 The median response time based on all reported fire incidents is 6 minutes. This is comparable to the state median value.
The median response time in Kenton, OH compared to nearest cities:
(Note: Based on data for all years, including only cities with at least 500 fire incidents)
| Kenton: | 6 minutes |
| Forest: | 11 minutes |
| Harrod: | 8 minutes |
| Bellefontaine: | 6 minutes |
| Upper Sandusky: | 7 minutes |
| Richwood: | 9 minutes |
| Marion: | 6 minutes |
| Lima: | 4 minutes |
| Findlay: | 6 minutes |
 Based on the data from the years 2002 - 2018 the average number of fire-related fatalities per year is 0. The highest number of reported deaths - 2 took place in 2015, and the lowest - 0 in 2003. The data has a dropping trend.
 Based on the reports from the years 2002 - 2018 the average number of fire-related casualties per year is 2. The highest number of reported casualties - 5 took place in 2015, and the lowest - 0 in 2013. The data has a decreasing trend.
The average number of casualties per 1,000 fire incidents is 21. This indicator was the highest - 69 in 2002, and the lowest 0 in 2013. The trend for injuries per 1,000 fires is dropping. Compared to the Ohio value the number of casualties per 1,000 fire incidents is higher.
Based on the reports from the years 2002 - 2018 the average number of fire-related casualties per year is 2. The highest number of reported casualties - 5 took place in 2015, and the lowest - 0 in 2013. The data has a decreasing trend.
The average number of casualties per 1,000 fire incidents is 21. This indicator was the highest - 69 in 2002, and the lowest 0 in 2013. The trend for injuries per 1,000 fires is dropping. Compared to the Ohio value the number of casualties per 1,000 fire incidents is higher.Casualties per 1,000 incidents in Kenton, OH compared to nearest cities:
(Note: Based on data for all years, including only cities with at least 500 fire incidents)
| Kenton: | 19.1 |
| Forest: | 1.7 |
| Harrod: | 1.7 |
| Bellefontaine: | 27.9 |
| Upper Sandusky: | 4.9 |
| Richwood: | 18.7 |
| Marion: | 6.7 |
| Lima: | 23.4 |
| Findlay: | 25.8 |
 31.9% incidents where reported in the morning and 68.1% in the evening. The most fires (16.4%) took place on Sunday, and the least (11.8%) on Thursday.
 According to the 1,411 reports from years 2002 - 2018 most fires (10.4%) took place during April, and the least (6.2%) in September.
 Out of all 3,899 cases reported during the years 2002 - 2018, the most belonged to the categories: Fire (36.2%), Hazardous Condition (22.3%), and Rescue & EMS (16.7%).
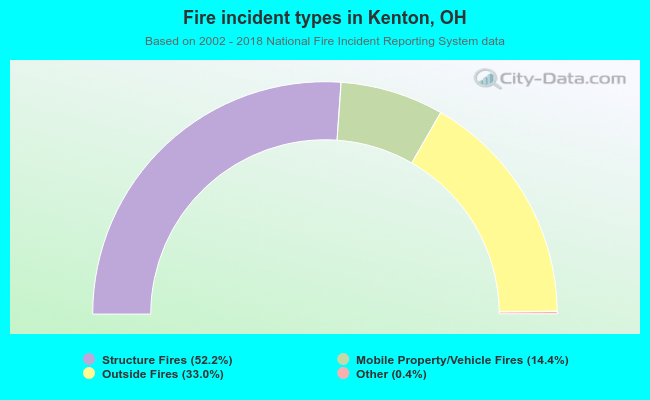 When looking into fire subcategories, the most reports belonged to: Structure Fires (52.2%), and Outside Fires (33.0%).