Flushing: Fire Incidents, Michigan (MI)
Where are fire incidents reported in Flushing, MI
Something went wrong! Please refresh the page.
| Fire incidents reported | |
|---|---|
| Sreet name | Count |
| MCKINLEY RD | 148 |
| SEYMOUR RD | 120 |
| COLDWATER RD | 86 |
| PIERSON RD | 82 |
| ELMS RD | 70 |
| MAIN ST | 70 |
| DUFFIELD RD | 66 |
| STANLEY RD | 62 |
| NICHOLS RD | 50 |
| DELAND RD | 48 |
| COUTANT ST | 38 |
| POTTER RD | 38 |
| BEECHER RD | 36 |
| SHERIDAN RD | 36 |
| JOHNSON RD | 34 |
| MT MORRIS RD | 34 |
| MT. MORRIS RD | 34 |
| CARPENTER RD | 30 |
| CEDARWOOD DR | 30 |
| CALKINS RD | 28 |
| MORRISH RD | 28 |
| RIVER RD | 28 |
| SUFFOLK CT | 26 |
| TERRACE DR | 24 |
| FLUSHING RD | 22 |
| FRANCES RD | 22 |
| OLEKSYN RD | 20 |
| TURNER RD | 20 |
| TAHQUAMENON TRL | 18 |
| BEATRICE ST | 16 |
2002 - 2018 National Fire Incident Reporting System (NFIRS) incidents
- Incident types reported to NFIRS in Flushing, MI
- 1,12436.9%Fire
- 67922.3%Hazardous Condition
- 43214.2%False Alarm
- 36311.9%Service Call
- 32310.6%Good Intent Call
- 1183.9%Rescue & EMS
- 50.2%Severe Weather
- 40.1%Overpressure Rupture
- Fire incident types reported to NFIRS in Flushing, MI
- 72264.2%Structure Fires
- 21619.2%Outside Fires
- 11610.3%Mobile Property/Vehicle Fires
- 706.2%Other
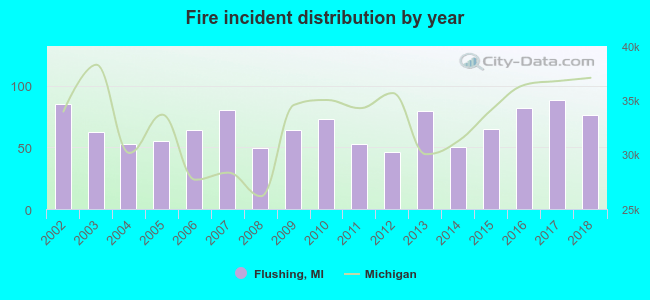 According to the data from the years 2002 - 2018 the average number of fire incidents per year is 66. The highest number of reported fires - 88 took place in 2017, and the least - 46 in 2012. The data has a declining trend.
The average number of yearly fire incidents per 10k residents in Flushing, MI compared to nearest cities:
(Note: Based on data for the last 3 years, including only cities with population 5,000 and above)
| Flushing: | 100.8 |
| Swartz Creek: | 131.2 |
| Flint: | 89.8 |
| Burton: | 27.3 |
| Grand Blanc: | 145.6 |
| Davison: | 116.7 |
| Owosso: | 55.9 |
| Fenton: | 91.6 |
| Holly: | 105.5 |
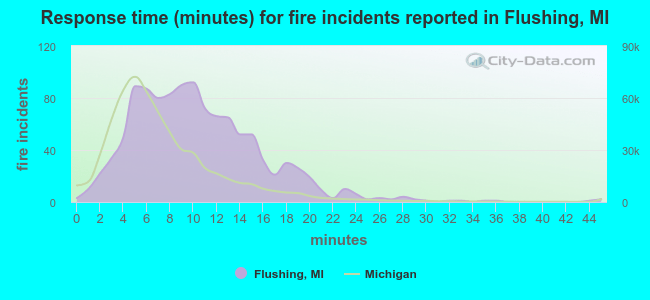 The median response time based on all reported fire incidents is 10 minutes. This is higher compared to the Michigan median value.
The median response time in Flushing, MI compared to nearest cities:
(Note: Based on data for all years, including only cities with at least 500 fire incidents)
| Flushing: | 10 minutes |
| Swartz Creek: | 9 minutes |
| Flint: | 7 minutes |
| Montrose: | 11 minutes |
| Clio: | 8 minutes |
| Burton: | 8 minutes |
| Durand: | 8 minutes |
| Burt: | 11 minutes |
| Birch Run: | 11 minutes |
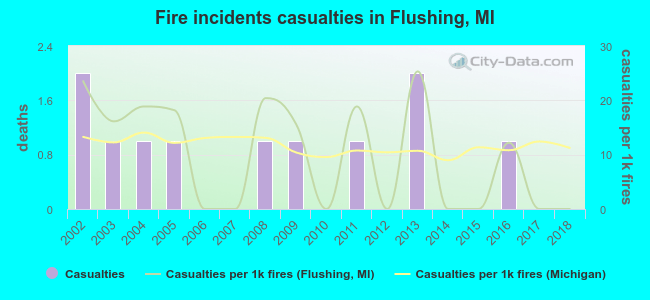 According to the data from the years 2002 - 2018 the average number of fire-related casualties per year is 1. The highest number of reported casualties - 2 took place in 2002, and the lowest - 0 in 2006. The data has a declining trend.
The average number of casualties per 1,000 fires is 10. This indicator was the highest - 25 in 2013, and the lowest 0 in 2006. The trend for casualties per 1,000 fire incidents is decreasing. Compared to the Michigan value the number of injuries per 1,000 fires is similar.
According to the data from the years 2002 - 2018 the average number of fire-related casualties per year is 1. The highest number of reported casualties - 2 took place in 2002, and the lowest - 0 in 2006. The data has a declining trend.
The average number of casualties per 1,000 fires is 10. This indicator was the highest - 25 in 2013, and the lowest 0 in 2006. The trend for casualties per 1,000 fire incidents is decreasing. Compared to the Michigan value the number of injuries per 1,000 fires is similar.
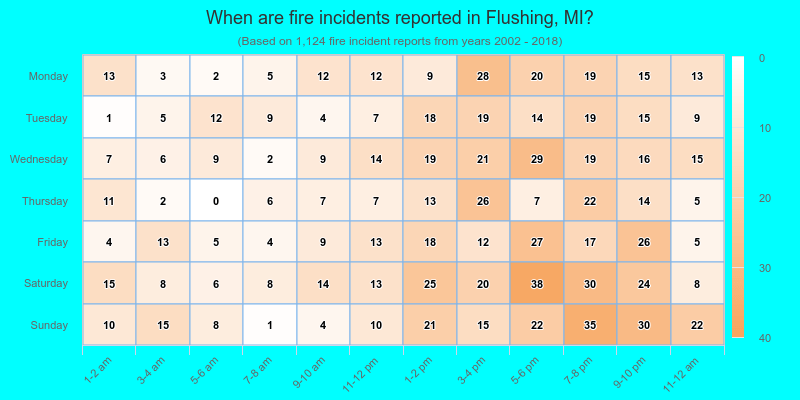
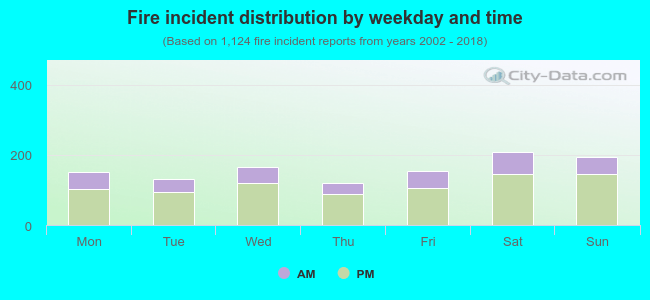 28.9% incidents where reported in the morning and 71.1% in the evening. The most fires (18.6%) took place on Saturday, and the least (10.7%) on Thursday.
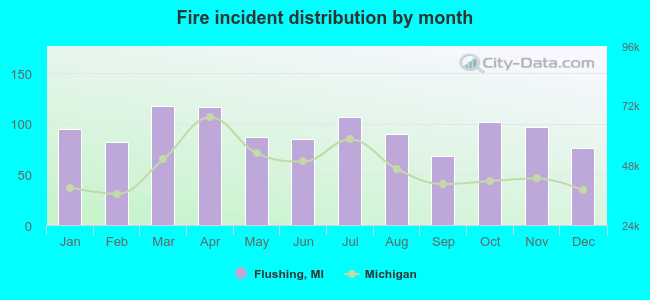 Based on the 1,124 fires from years 2002 - 2018 most fires (10.5%) took place during March, and the least (6.0%) in September.
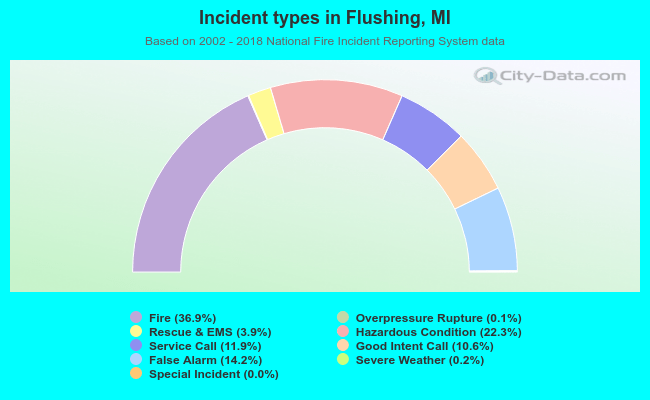 Out of all 3,049 cases reported during the years 2002 - 2018, the most belonged to the categories: Fire (36.9%), Hazardous Condition (22.3%), and False Alarm (14.2%).
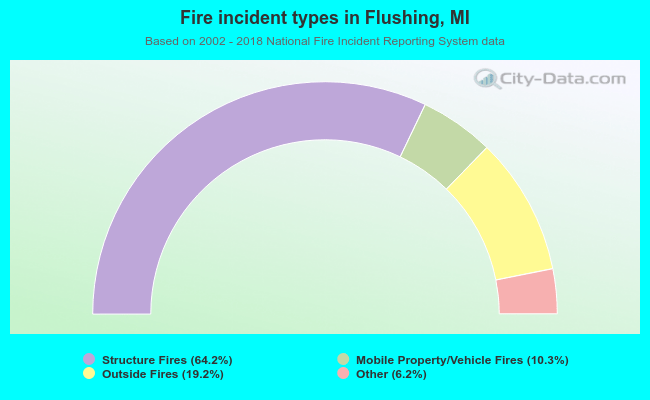 When looking into fire subcategories, the most incidents belonged to: Structure Fires (64.2%), and Outside Fires (19.2%).