Monroeville: Fire Incidents, Pennsylvania (PA)
Where are fire incidents reported in Monroeville, PA
Something went wrong! Please refresh the page.
|
| |||||||||||||||||||||||||||||||||||||||||||||||||||||||||||||||||||||||||||||||||||||||||||||||||||||||||||||
2005 - 2018 National Fire Incident Reporting System (NFIRS) incidents
- Incident types reported to NFIRS in Monroeville, PA
- 1,25728.7%False Alarm
- 97122.2%Good Intent Call
- 79218.1%Hazardous Condition
- 70116.0%Fire
- 52211.9%Rescue & EMS
- 952.2%Service Call
- 300.7%Overpressure Rupture
- 60.1%Severe Weather
- Fire incident types reported to NFIRS in Monroeville, PA
- 30543.5%Structure Fires
- 16523.5%Outside Fires
- 16022.8%Mobile Property/Vehicle Fires
- 7110.1%Other
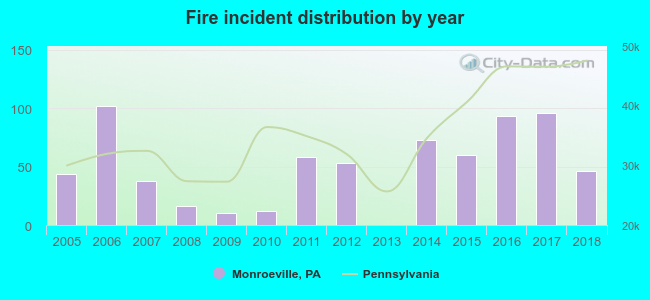 According to the data from the years 2005 - 2018 the average number of fire incidents per year is 50. The highest number of fires - 102 took place in 2006, and the least - 0 in 2013. The data has an increasing trend.
The average number of yearly fire incidents per 10k residents in Monroeville, PA compared to nearest cities:
(Note: Based on data for the last 3 years, including only cities with population 5,000 and above)
| Monroeville: | 27.7 |
| Turtle Creek: | 43.4 |
| North Versailles: | 41.8 |
| Forest Hills: | 31.9 |
| Penn Hills: | 18.7 |
| Murrysville: | 22.5 |
| Duquesne: | 61.6 |
| Wilkinsburg: | 31.6 |
| Swissvale: | 58.0 |
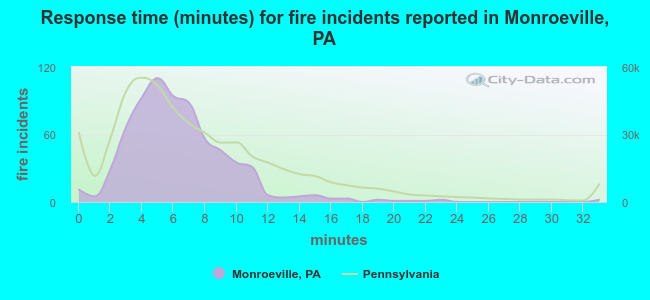 The median response time based on all reported fire incidents is 6 minutes. This is comparable to the Pennsylvania median value.
The median response time in Monroeville, PA compared to nearest cities:
(Note: Based on data for all years, including only cities with at least 500 fire incidents)
| Monroeville: | 6 minutes |
| Penn Hills: | 7 minutes |
| Murrysville: | 6 minutes |
| McKeesport: | 5 minutes |
| West Mifflin: | 7 minutes |
| Irwin: | 5 minutes |
| Export: | 2 minutes |
| Pittsburgh: | 4 minutes |
| Clairton: | 6 minutes |
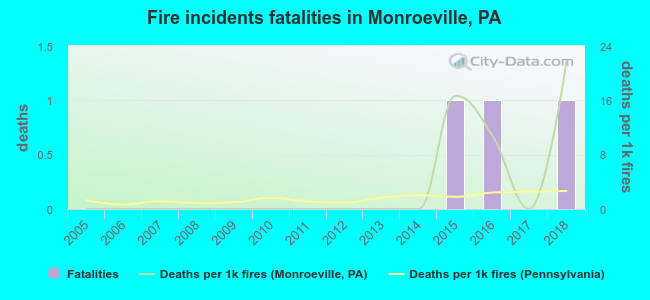 Based on the data from the years 2005 - 2018 the average number of fire-related yearly deaths is 0. The highest number of deaths - 1 took place in 2015, and the lowest - 0 in 2005. The data has a growing trend.
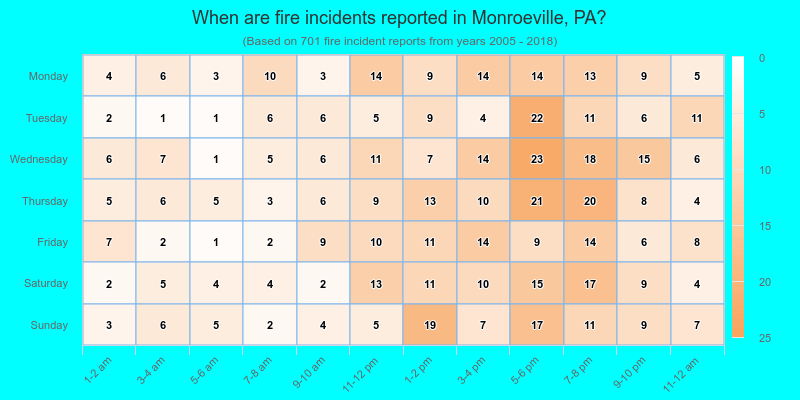
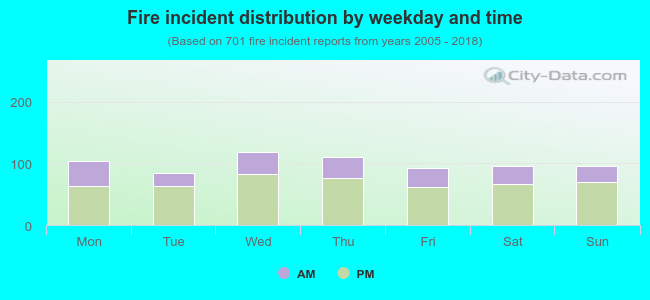 31.0% incidents where reported in the morning and 69.0% in the evening. The most fires (17.0%) took place on Wednesday, and the least (12.0%) on Tuesday.
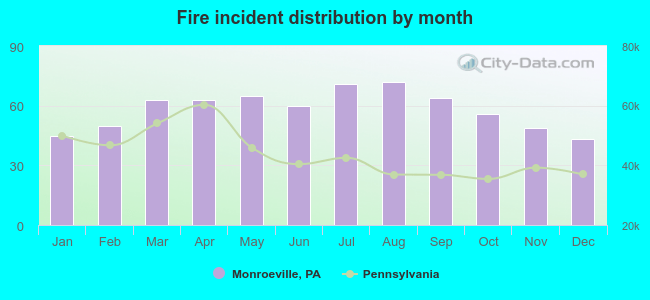 According to the 701 fire incidents from years 2005 - 2018 most fires (10.3%) took place during August, and the least (6.1%) in December.
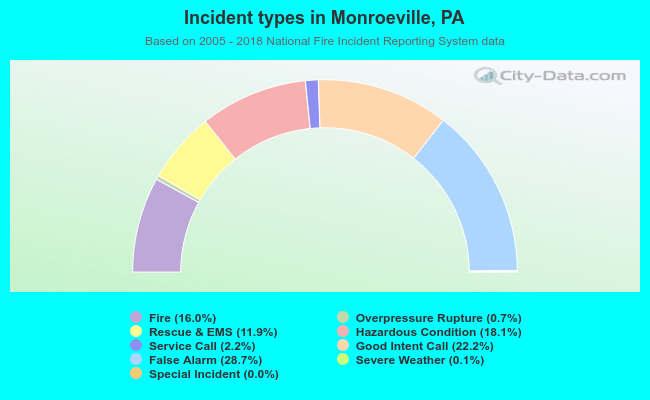 Out of all 4,376 cases reported during the years 2005 - 2018, the most belonged to the categories: False Alarm (28.7%), Good Intent Call (22.2%), and Hazardous Condition (18.1%).
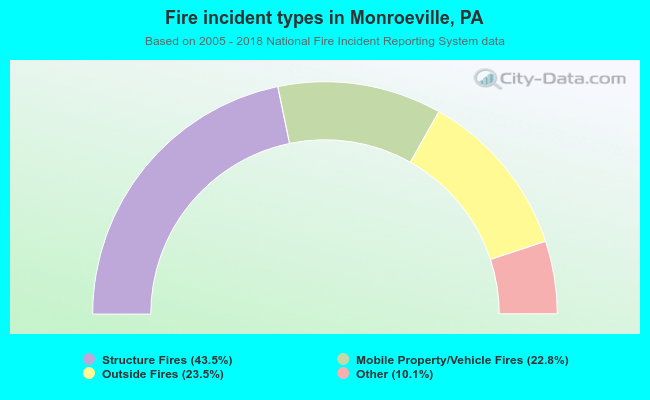 When looking into fire subcategories, the most incidents belonged to: Structure Fires (43.5%), and Outside Fires (23.5%).