Oak Park: Fire Incidents, Illinois (IL)
Where are fire incidents reported in Oak Park, IL
Something went wrong! Please refresh the page.
| Fire incidents reported | |
|---|---|
| Sreet name | Count |
| HUMPHREY AVE | 202 |
| LAKE ST | 198 |
| OAK PARK AVE | 174 |
| AUSTIN BLVD | 168 |
| TAYLOR AVE | 134 |
| KENILWORTH AVE | 128 |
| RIDGELAND AVE | 122 |
| MADISON ST | 120 |
| LOMBARD AVE | 104 |
| GROVE AVE | 98 |
| MAPLE AVE | 98 |
| EAST AVE | 96 |
| HARLEM AVE | 96 |
| MARION ST | 96 |
| ELMWOOD AVE | 80 |
| HARVEY AVE | 80 |
| NORTH AVE | 80 |
| ROOSEVELT RD | 80 |
| CUYLER AVE | 78 |
| EUCLID AVE | 78 |
| FOREST AVE | 78 |
| CHICAGO AVE | 76 |
| EISENHOWER EXPY | 76 |
| WASHINGTON BLVD | 70 |
| NORTH BLVD | 68 |
| AUSTIN | 60 |
| WISCONSIN AVE | 60 |
| CLINTON AVE | 58 |
| HARRISON ST | 58 |
| HOME AVE | 56 |
2002 - 2018 National Fire Incident Reporting System (NFIRS) incidents
- Incident types reported to NFIRS in Oak Park, IL
- 20,28155.6%Rescue & EMS
- 5,17414.2%Service Call
- 3,4949.6%False Alarm
- 2,7057.4%Good Intent Call
- 2,5787.1%Hazardous Condition
- 2,1475.9%Fire
- Fire incident types reported to NFIRS in Oak Park, IL
- 1,29960.5%Structure Fires
- 57126.6%Outside Fires
- 26512.3%Mobile Property/Vehicle Fires
- 120.6%Other
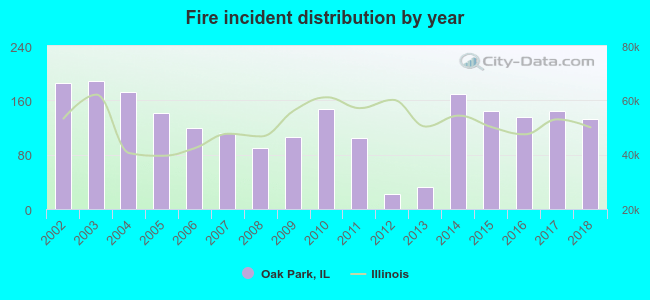 Based on the data from the years 2002 - 2018 the average number of fire incidents per year is 126. The highest number of reported fires - 188 took place in 2003, and the least - 22 in 2012. The data has a decreasing trend.
The average number of yearly fire incidents per 10k residents in Oak Park, IL compared to nearest cities:
(Note: Based on data for the last 3 years, including only cities with population 5,000 and above)
| Oak Park: | 26.3 |
| Forest Park: | 45.8 |
| River Forest: | 50.6 |
| Maywood: | 58.8 |
| Elmwood Park: | 26.3 |
| Berwyn: | 23.0 |
| Cicero: | 25.7 |
| North Riverside: | 31.4 |
| Melrose Park: | 35.1 |
 The median response time based on all reported fire incidents is 5 minutes. This is similar to the Illinois median value.
The median response time in Oak Park, IL compared to nearest cities:
(Note: Based on data for all years, including only cities with at least 500 fire incidents)
| Oak Park: | 5 minutes |
| Forest Park: | 5 minutes |
| River Forest: | 6 minutes |
| Maywood: | 3 minutes |
| Elmwood Park: | 5 minutes |
| Berwyn: | 3 minutes |
| Cicero: | 3 minutes |
| Melrose Park: | 4 minutes |
| River Grove: | 4 minutes |
 According to the reports from the years 2002 - 2018 the average number of fire-related yearly casualties is 1. The highest number of reported casualties - 6 took place in 2003, and the lowest - 0 in 2012. The data has a constant trend.
The average number of casualties per 1,000 fire incidents is 10. This indicator was the highest - 32 in 2003, and the lowest 0 in 2012. The trend for injuries per 1,000 fires is rising. Compared to the state value the number of injuries per 1,000 incidents is similar.
According to the reports from the years 2002 - 2018 the average number of fire-related yearly casualties is 1. The highest number of reported casualties - 6 took place in 2003, and the lowest - 0 in 2012. The data has a constant trend.
The average number of casualties per 1,000 fire incidents is 10. This indicator was the highest - 32 in 2003, and the lowest 0 in 2012. The trend for injuries per 1,000 fires is rising. Compared to the state value the number of injuries per 1,000 incidents is similar.Casualties per 1,000 incidents in Oak Park, IL compared to nearest cities:
(Note: Based on data for all years, including only cities with at least 500 fire incidents)
| Oak Park: | 11.2 |
| Forest Park: | 8.3 |
| River Forest: | 5.5 |
| Maywood: | 6.1 |
| Elmwood Park: | 3.5 |
| Berwyn: | 15.9 |
| Cicero: | 13.7 |
| Melrose Park: | 12.3 |
| River Grove: | 3.1 |
 32.3% incidents where reported in the morning and 67.7% in the evening. The most fires (16.3%) took place on Tuesday, and the least (12.7%) on Friday.
 According to the 2,147 fires from years 2002 - 2018 most fires (10.9%) took place during October, and the least (6.1%) in February.
 Out of all 36,449 cases reported during the years 2002 - 2018, the most belonged to the categories: Rescue & EMS (55.6%), Service Call (14.2%), and False Alarm (9.6%).
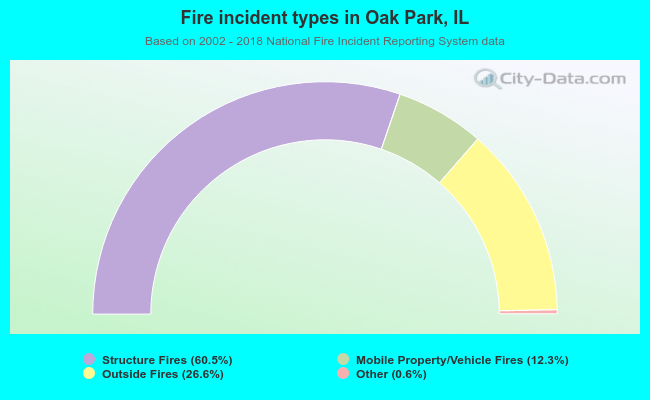 When looking into fire subcategories, the most incidents belonged to: Structure Fires (60.5%), and Outside Fires (26.6%).