Fort Pierce: Fire Incidents, Florida (FL)
Where are fire incidents reported in Fort Pierce, FL
Something went wrong! Please refresh the page.
| Fire incidents reported | |
|---|---|
| Sreet name | Count |
| US HIGHWAY 1 | 242 |
| INTERSTATE 95 | 210 |
| ORANGE AVE | 188 |
| OKEECHOBEE | 160 |
| SUNSHINE STATE PKWY | 136 |
| MIDWAY | 98 |
| U S HIGHWAY 1 | 98 |
| INDIAN RIVER DR | 80 |
| OCEAN DR | 76 |
| AVENUE B | 70 |
| 25TH ST | 68 |
| KINGS | 66 |
| GLADES CUT OFF | 64 |
| ANGLE | 58 |
| OLEANDER AVE | 58 |
| 29TH ST | 52 |
| 7TH ST | 48 |
| EDWARDS | 46 |
| 13TH ST | 44 |
| SUNRISE BLVD | 44 |
| VIRGINIA AVE | 44 |
| TURNPIKE | 42 |
| OKEECHOBEE RD | 40 |
| WEATHERBEE | 40 |
| 10TH ST | 38 |
| HIGHWAY A1A | 38 |
| ST LUCIE WEST BLVD | 38 |
| 33RD ST | 36 |
| INDRIO | 36 |
| BROCKSMITH | 34 |
| Other | 1,999 |
2003 - 2018 National Fire Incident Reporting System (NFIRS) incidents
- Incident types reported to NFIRS in Fort Pierce, FL
- 96,82983.6%Rescue & EMS
- 5,7204.9%False Alarm
- 5,4424.7%Good Intent Call
- 4,2913.7%Fire
- 2,2612.0%Hazardous Condition
- 1,0590.9%Service Call
- Fire incident types reported to NFIRS in Fort Pierce, FL
- 2,56659.8%Outside Fires
- 88220.6%Mobile Property/Vehicle Fires
- 81218.9%Structure Fires
- 310.7%Other
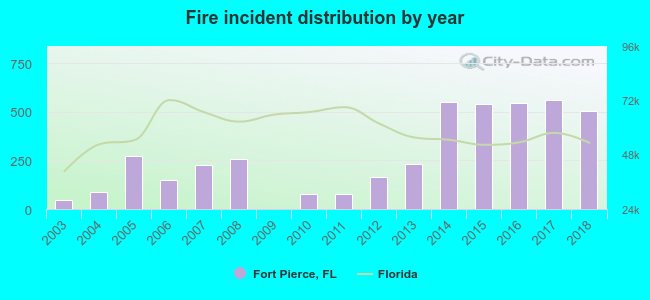 Based on the data from the years 2003 - 2018 the average number of fire incidents per year is 268. The highest number of reported fire incidents - 560 took place in 2017, and the least - 0 in 2009. The data has a rising trend.
The average number of yearly fire incidents per 10k residents in Fort Pierce, FL compared to nearest cities:
(Note: Based on data for the last 3 years, including only cities with population 5,000 and above)
| Fort Pierce: | 123.2 |
| Vero Beach: | 238.7 |
| Jensen Beach: | 27.0 |
| Stuart: | 46.7 |
| Palm City: | 21.5 |
| Port Salerno: | 1.0 |
| Sebastian: | 27.4 |
| Hobe Sound: | 18.7 |
| Fellsmere: | 52.7 |
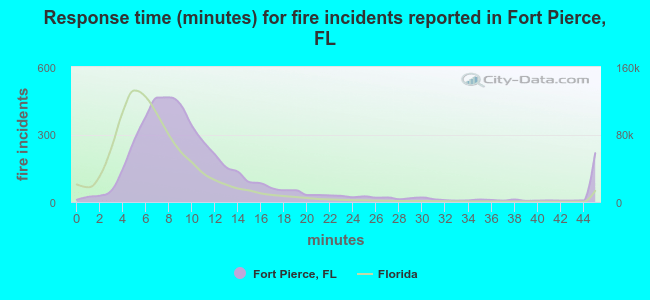 The median response time based on all reported fire incidents is 9 minutes. This is higher compared to the state median value.
The median response time in Fort Pierce, FL compared to nearest cities:
(Note: Based on data for all years, including only cities with at least 500 fire incidents)
| Fort Pierce: | 9 minutes |
| Vero Beach: | 8 minutes |
| Jensen Beach: | 8 minutes |
| Stuart: | 7 minutes |
| Palm City: | 11 minutes |
| Sebastian: | 8 minutes |
| Fellsmere: | 8 minutes |
| Okeechobee: | 9 minutes |
| Jupiter: | 7 minutes |
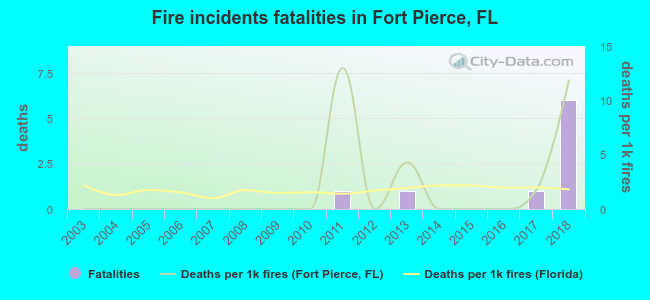 According to the data from the years 2003 - 2018 the average number of fire-related yearly deaths is 1. The highest number of reported deaths - 6 took place in 2018, and the lowest - 0 in 2003. The data has an increasing trend.
The average number of deaths per 1,000 fire incidents is 2. This indicator was the highest - 13 in 2011, and the lowest 0 in 2003. The trend for deaths per 1,000 incidents is increasing. Compared to the Florida value the number of fatalities per 1,000 incidents is higher.
According to the data from the years 2003 - 2018 the average number of fire-related yearly deaths is 1. The highest number of reported deaths - 6 took place in 2018, and the lowest - 0 in 2003. The data has an increasing trend.
The average number of deaths per 1,000 fire incidents is 2. This indicator was the highest - 13 in 2011, and the lowest 0 in 2003. The trend for deaths per 1,000 incidents is increasing. Compared to the Florida value the number of fatalities per 1,000 incidents is higher.Deaths per 1,000 incidents in Fort Pierce, FL compared to nearest cities:
(Note: Based on data for all years, including only cities with at least 2,500 fire incidents)
| Fort Pierce: | 2.1 |
| Vero Beach: | 0.2 |
| Okeechobee: | 2.6 |
| Palm Bay: | 2.2 |
| Melbourne: | 2.4 |
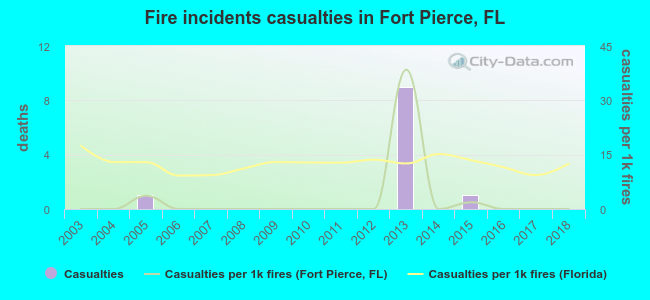 According to the data from the years 2003 - 2018 the average number of fire-related yearly casualties is 1. The highest number of reported casualties - 9 took place in 2013, and the lowest - 0 in 2003. The data has a constant trend.
The average number of injuries per 1,000 fire incidents is 3. This indicator was the highest - 38 in 2013, and the lowest 0 in 2003. The trend for injuries per 1,000 fires is constant. Compared to the state value the number of casualties per 1,000 fire incidents is much lower.
According to the data from the years 2003 - 2018 the average number of fire-related yearly casualties is 1. The highest number of reported casualties - 9 took place in 2013, and the lowest - 0 in 2003. The data has a constant trend.
The average number of injuries per 1,000 fire incidents is 3. This indicator was the highest - 38 in 2013, and the lowest 0 in 2003. The trend for injuries per 1,000 fires is constant. Compared to the state value the number of casualties per 1,000 fire incidents is much lower.Casualties per 1,000 incidents in Fort Pierce, FL compared to nearest cities:
(Note: Based on data for all years, including only cities with at least 500 fire incidents)
| Fort Pierce: | 2.6 |
| Vero Beach: | 2.2 |
| Jensen Beach: | 9.0 |
| Stuart: | 10.3 |
| Palm City: | 11.7 |
| Sebastian: | 1.0 |
| Fellsmere: | 0.0 |
| Okeechobee: | 8.4 |
| Jupiter: | 23.9 |
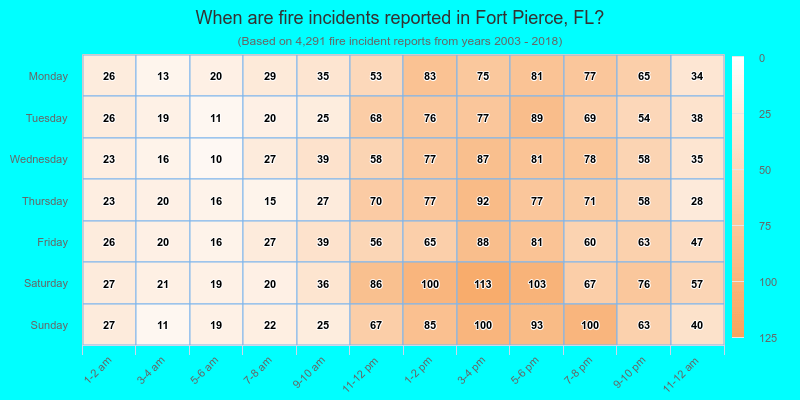
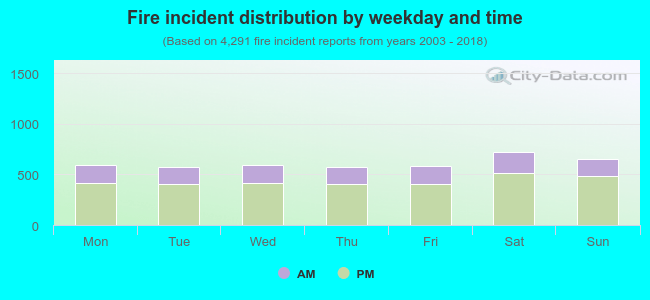 29.2% incidents where reported in the morning and 70.8% in the evening. The most fires (16.9%) took place on Saturday, and the least (13.3%) on Tuesday.
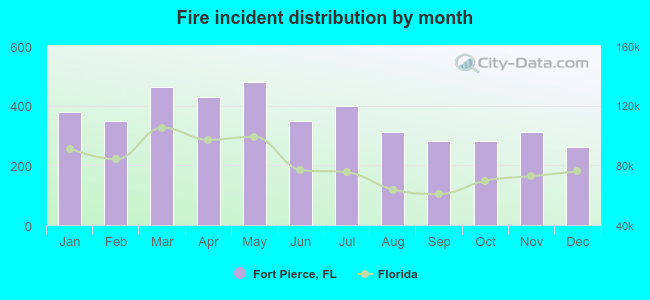 Based on the 4,291 incident reports from years 2003 - 2018 most fires (11.2%) took place during May, and the least (6.1%) in December.
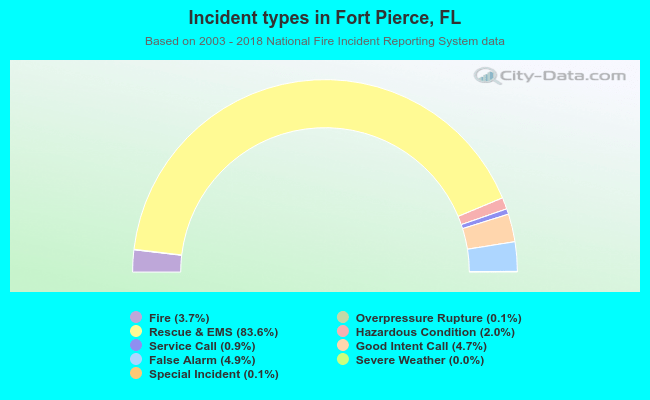 Out of all 115,763 cases reported during the years 2003 - 2018, the most belonged to the categories: Rescue & EMS (83.6%), False Alarm (4.9%), and Good Intent Call (4.7%).
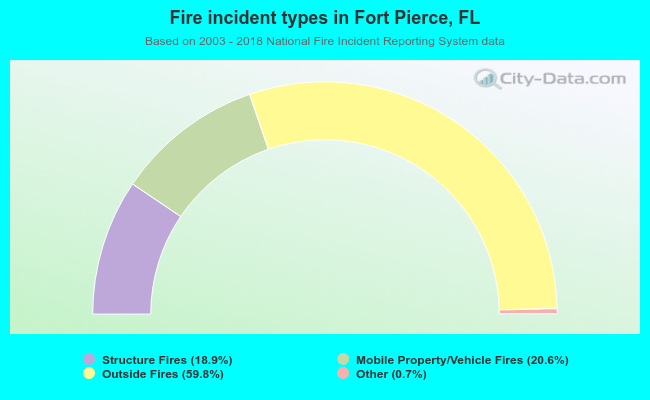 When looking into fire subcategories, the most reports belonged to: Outside Fires (59.8%), and Mobile Property/Vehicle Fires (20.6%).