Palm Bay: Fire Incidents, Florida (FL)
Where are fire incidents reported in Palm Bay, FL
Something went wrong! Please refresh the page.
| Fire incidents reported | |
|---|---|
| Sreet name | Count |
| MALABAR RD | 230 |
| EMERSON DR | 168 |
| BABCOCK ST | 124 |
| PALM BAY RD | 74 |
| JUPITER BLVD | 70 |
| KENTUCKY DR | 70 |
| ST ANDRE BLVD | 60 |
| DIXIE HWY | 58 |
| JA BOMBARDIER BLVD | 50 |
| PORT MALABAR BLVD | 44 |
| DE GROODT RD | 42 |
| QUENTIN AVE | 40 |
| PINEWOOD DR | 38 |
| GLENCOVE AVE | 36 |
| J A BOMBARDIER BLVD | 36 |
| COGAN DR | 32 |
| ELDRON BLVD | 32 |
| ROBERT J CONLAN BLVD | 32 |
| SAN FILIPPO DR | 32 |
| MINTON RD | 30 |
| GARVEY RD | 28 |
| LOFFLER CIR | 28 |
| SAPODILLA RD | 28 |
| CANOVA ST | 26 |
| WINGHAM DR | 26 |
| AGORA CIR | 22 |
| AMERICANA BLVD | 22 |
| ANGORA ST | 22 |
| I95 | 22 |
| I95 HWY | 22 |
| Other | 1,671 |
2004 - 2018 National Fire Incident Reporting System (NFIRS) incidents
- Incident types reported to NFIRS in Palm Bay, FL
- 66,28174.4%Rescue & EMS
- 8,0599.1%Service Call
- 6,8347.7%Good Intent Call
- 3,2153.6%Fire
- 1,9122.1%False Alarm
- 1,5291.7%Hazardous Condition
- 1,1541.3%Special Incident
- Fire incident types reported to NFIRS in Palm Bay, FL
- 2,08864.9%Outside Fires
- 56517.6%Structure Fires
- 43213.4%Mobile Property/Vehicle Fires
- 1304.0%Other
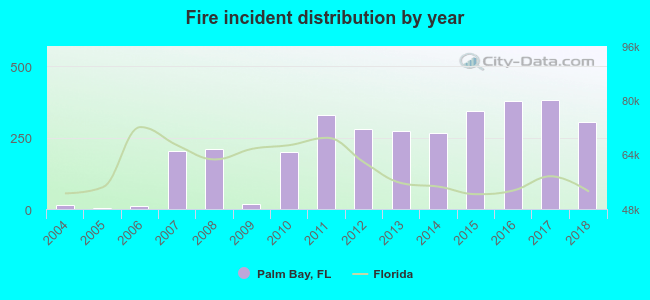 Based on the data from the years 2004 - 2018 the average number of fire incidents per year is 214. The highest number of fire incidents - 380 took place in 2017, and the least - 4 in 2005. The data has an increasing trend.
The average number of yearly fire incidents per 10k residents in Palm Bay, FL compared to nearest cities:
(Note: Based on data for the last 3 years, including only cities with population 5,000 and above)
| Palm Bay: | 33.4 |
| West Melbourne: | 38.0 |
| Melbourne: | 26.1 |
| Micco: | 28.0 |
| Indian Harbour Beach: | 12.8 |
| Satellite Beach: | 27.5 |
| Fellsmere: | 52.7 |
| South Patrick Shores: | 4.5 |
| Sebastian: | 27.4 |
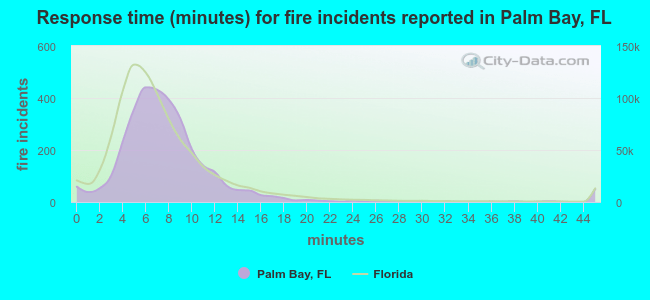 The median response time based on all reported fire incidents is 7 minutes. This is close to the state median value.
The median response time in Palm Bay, FL compared to nearest cities:
(Note: Based on data for all years, including only cities with at least 500 fire incidents)
| Palm Bay: | 7 minutes |
| Malabar: | 6 minutes |
| West Melbourne: | 7 minutes |
| Melbourne: | 5 minutes |
| Satellite Beach: | 5 minutes |
| Fellsmere: | 8 minutes |
| Sebastian: | 8 minutes |
| Rockledge: | 5 minutes |
| Merritt Island: | 7 minutes |
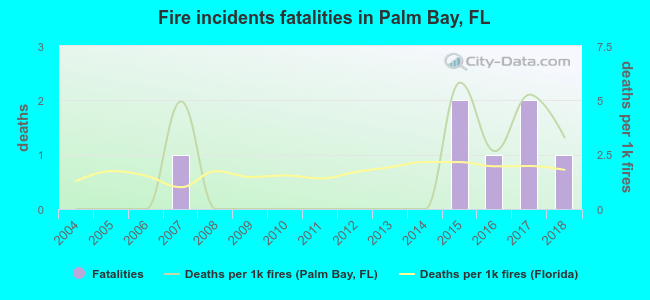 Based on the data from the years 2004 - 2018 the average number of fire-related yearly deaths is 0. The highest number of reported deaths - 2 took place in 2015, and the lowest - 0 in 2004. The data has a growing trend.
The average number of fatalities per 1,000 fires is 1. This indicator was the highest - 6 in 2015, and the lowest 0 in 2004. The trend for deaths per 1,000 fire incidents is rising. Compared to the Florida value the number of deaths per 1,000 fire incidents is higher.
Based on the data from the years 2004 - 2018 the average number of fire-related yearly deaths is 0. The highest number of reported deaths - 2 took place in 2015, and the lowest - 0 in 2004. The data has a growing trend.
The average number of fatalities per 1,000 fires is 1. This indicator was the highest - 6 in 2015, and the lowest 0 in 2004. The trend for deaths per 1,000 fire incidents is rising. Compared to the Florida value the number of deaths per 1,000 fire incidents is higher.Deaths per 1,000 incidents in Palm Bay, FL compared to nearest cities:
(Note: Based on data for all years, including only cities with at least 2,500 fire incidents)
| Palm Bay: | 2.2 |
| Melbourne: | 2.4 |
| Cocoa: | 1.3 |
| Vero Beach: | 0.2 |
| Fort Pierce: | 2.1 |
| Titusville: | 2.9 |
| Kissimmee: | 1.4 |
| Okeechobee: | 2.6 |
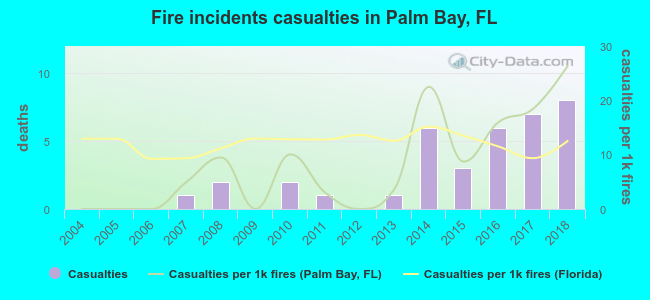 According to the data from the years 2004 - 2018 the average number of fire-related yearly casualties is 2. The highest number of casualties - 8 took place in 2018, and the lowest - 0 in 2004. The data has a rising trend.
The average number of casualties per 1,000 fire incidents is 8. This indicator was the highest - 26 in 2018, and the lowest 0 in 2004. The trend for injuries per 1,000 fires is rising. Compared to the state value the number of injuries per 1,000 fire incidents is similar.
According to the data from the years 2004 - 2018 the average number of fire-related yearly casualties is 2. The highest number of casualties - 8 took place in 2018, and the lowest - 0 in 2004. The data has a rising trend.
The average number of casualties per 1,000 fire incidents is 8. This indicator was the highest - 26 in 2018, and the lowest 0 in 2004. The trend for injuries per 1,000 fires is rising. Compared to the state value the number of injuries per 1,000 fire incidents is similar.Casualties per 1,000 incidents in Palm Bay, FL compared to nearest cities:
(Note: Based on data for all years, including only cities with at least 500 fire incidents)
| Palm Bay: | 11.5 |
| Malabar: | 1.8 |
| West Melbourne: | 7.1 |
| Melbourne: | 19.4 |
| Satellite Beach: | 14.8 |
| Fellsmere: | 0.0 |
| Sebastian: | 1.0 |
| Rockledge: | 18.6 |
| Merritt Island: | 10.1 |
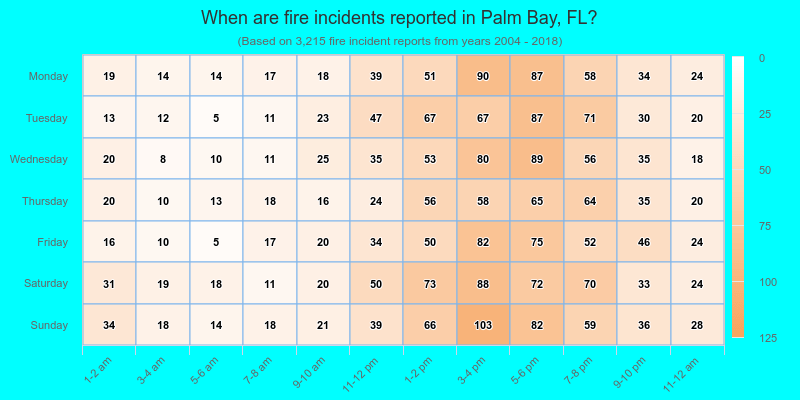
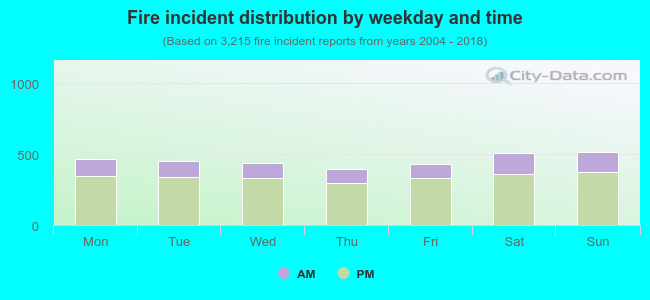 26.0% incidents where reported in the morning and 74.0% in the evening. The most fires (16.1%) took place on Sunday, and the least (12.4%) on Thursday.
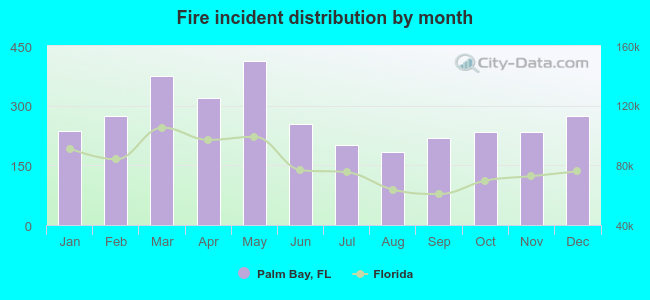 Based on the 3,215 fire incidents from years 2004 - 2018 most fires (12.8%) took place during May, and the least (5.7%) in August.
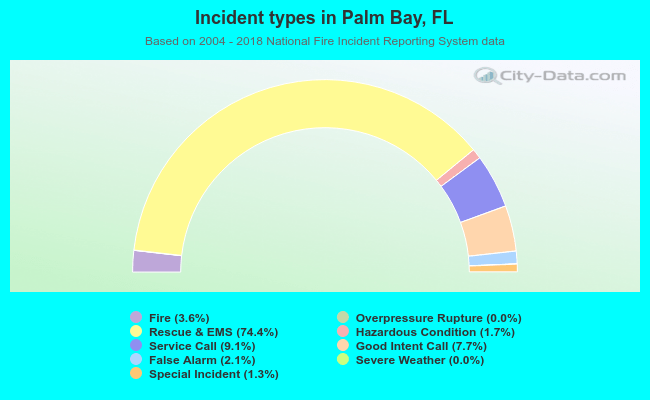 Out of all 89,039 cases reported during the years 2004 - 2018, the most belonged to the categories: Rescue & EMS (74.4%), Service Call (9.1%), and Good Intent Call (7.7%).
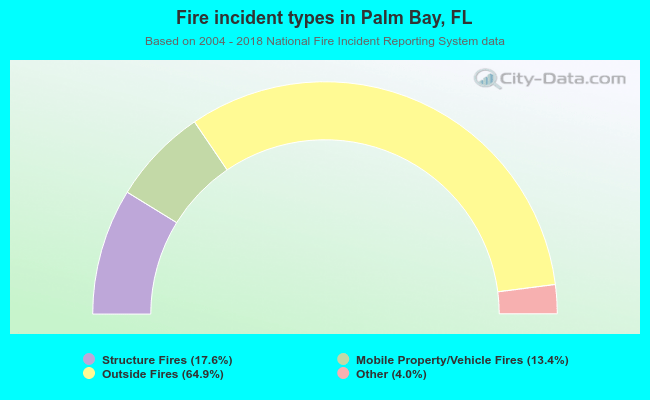 When looking into fire subcategories, the most reports belonged to: Outside Fires (64.9%), and Structure Fires (17.6%).