Florence: Fire Incidents, Kentucky (KY)
Where are fire incidents reported in Florence, KY
Something went wrong! Please refresh the page.
| Fire incidents reported | |
|---|---|
| Sreet name | Count |
| MALL RD | 460 |
| DIXIE HWY | 336 |
| HOUSTON RD | 318 |
| US 42 HWY | 256 |
| TURFWAY RD | 250 |
| BURLINGTON PK | 238 |
| INTERSTATE 71/75 | 220 |
| MT ZION RD | 178 |
| INTERSTATE 7175 | 164 |
| INDUSTRIAL RD | 130 |
| MAIN ST | 128 |
| EWING BLVD | 114 |
| SHENANDOAH DR | 82 |
| EMPIRE DR | 76 |
| US HIGHWAY 42 | 72 |
| DREAM ST | 62 |
| TAMARACK CIR | 62 |
| INTERSTATE 75 | 60 |
| CONNECTOR DR | 56 |
| MEIJER DR | 56 |
| OAKWOOD DR | 50 |
| DEER TRACE DR | 48 |
| HILLCREST DR | 46 |
| MELINDA LN | 44 |
| SPIRAL DR | 44 |
| WETHERINGTON BLVD | 44 |
| LLOYD AVE | 40 |
| TOEBBEN DR | 40 |
| BANKERS ST | 38 |
| CAVALIER BLVD | 38 |
2002 - 2018 National Fire Incident Reporting System (NFIRS) incidents
- Incident types reported to NFIRS in Florence, KY
- 12,06245.9%Rescue & EMS
- 3,59713.7%Fire
- 3,50813.3%Hazardous Condition
- 3,20312.2%Good Intent Call
- 2,5459.7%False Alarm
- 1,2414.7%Service Call
- 520.2%Severe Weather
- 500.2%Overpressure Rupture
- 270.1%Special Incident
- Fire incident types reported to NFIRS in Florence, KY
- 1,66046.1%Outside Fires
- 1,17832.7%Structure Fires
- 64417.9%Mobile Property/Vehicle Fires
- 1153.2%Other
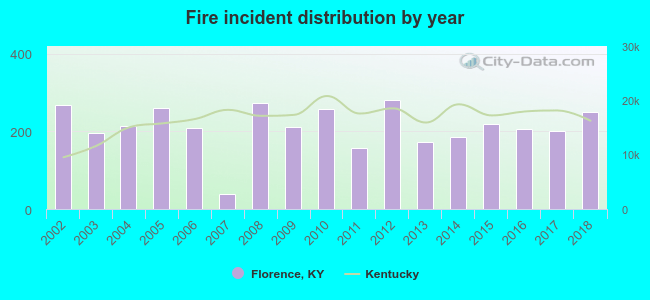 According to the data from the years 2002 - 2018 the average number of fire incidents per year is 212. The highest number of fire incidents - 280 took place in 2012, and the least - 39 in 2007. The data has a declining trend.
The average number of yearly fire incidents per 10k residents in Florence, KY compared to nearest cities:
(Note: Based on data for the last 3 years, including only cities with population 5,000 and above)
| Florence: | 68.6 |
| Elsmere: | 33.3 |
| Erlanger: | 44.2 |
| Union: | 36.6 |
| Edgewood: | 17.9 |
| Burlington: | 20.1 |
| Villa Hills: | 16.2 |
| Fort Mitchell: | 26.6 |
| Independence: | 26.2 |
 The median response time based on all reported fire incidents is 6 minutes. This is comparable to the state median value.
The median response time in Florence, KY compared to nearest cities:
(Note: Based on data for all years, including only cities with at least 500 fire incidents)
| Florence: | 6 minutes |
| Erlanger: | 5 minutes |
| Burlington: | 7 minutes |
| Independence: | 5 minutes |
| Fort Wright: | 6 minutes |
| Hebron: | 6 minutes |
| Covington: | 4 minutes |
| Newport: | 4 minutes |
| Lawrenceburg: | 8 minutes |
 According to the reports from the years 2002 - 2018 the average number of fire-related yearly casualties is 3. The highest number of injuries - 6 took place in 2011, and the lowest - 1 in 2002. The data has an increasing trend.
The average number of injuries per 1,000 fire incidents is 16. This indicator was the highest - 38 in 2011, and the lowest 4 in 2008. The trend for injuries per 1,000 incidents is growing. Compared to the state value the number of casualties per 1,000 fire incidents is much higher.
According to the reports from the years 2002 - 2018 the average number of fire-related yearly casualties is 3. The highest number of injuries - 6 took place in 2011, and the lowest - 1 in 2002. The data has an increasing trend.
The average number of injuries per 1,000 fire incidents is 16. This indicator was the highest - 38 in 2011, and the lowest 4 in 2008. The trend for injuries per 1,000 incidents is growing. Compared to the state value the number of casualties per 1,000 fire incidents is much higher.Casualties per 1,000 incidents in Florence, KY compared to nearest cities:
(Note: Based on data for all years, including only cities with at least 500 fire incidents)
| Florence: | 14.5 |
| Erlanger: | 5.0 |
| Burlington: | 14.4 |
| Independence: | 8.4 |
| Fort Wright: | 3.9 |
| Hebron: | 3.9 |
| Covington: | 14.0 |
| Newport: | 20.2 |
| Lawrenceburg: | 2.8 |
 29.3% incidents where reported in the morning and 70.7% in the evening. The most fires (15.7%) took place on Thursday, and the least (13.2%) on Sunday.
 Based on the 3,597 fire incident reports from years 2002 - 2018 most fires (11.4%) took place during July, and the least (5.6%) in December.
 Out of all 26,285 cases reported during the years 2002 - 2018, the most belonged to the categories: Rescue & EMS (45.9%), Fire (13.7%), and Hazardous Condition (13.3%).
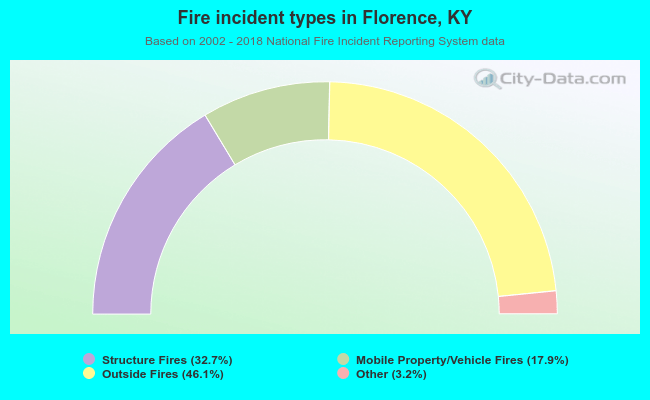 When looking into fire subcategories, the most incidents belonged to: Outside Fires (46.1%), and Structure Fires (32.7%).