Gibsonville: Fire Incidents, North Carolina (NC)
Where are fire incidents reported in Gibsonville, NC
Something went wrong! Please refresh the page.
| Fire incidents reported | |
|---|---|
| Sreet name | Count |
| NC 61 NORTH HWY | 94 |
| HUFFINE MILL RD | 66 |
| COTTON RD | 64 |
| HIGH ROCK RD | 62 |
| BURLINGTON RD | 58 |
| HUFFINES ST | 56 |
| SLADE ST | 56 |
| CARMON RD | 48 |
| JOYNER ST | 48 |
| BURLINGTON AVE | 42 |
| CHURCH ST | 42 |
| MINNEOLA ST | 42 |
| PEEDEN DR | 42 |
| RAILROAD AVE | 34 |
| SPRINGWOOD AVE | 34 |
| NC 61 HWY | 32 |
| SMITH ST | 32 |
| FRIEDEN CHURCH RD | 28 |
| STEELE ST | 28 |
| COOK RD | 26 |
| HOMESTEAD ST | 26 |
| POWER LINE RD | 26 |
| TROXLER MILL RD | 26 |
| WALNUT CROSSING DR | 26 |
| BELL RD | 24 |
| PIEDMONT AVE | 24 |
| ROSEMONT ST | 24 |
| SEDALIA RD | 22 |
| WAGONER RD | 22 |
| ALAMANCE ST | 20 |
| Other | 281 |
2002 - 2018 National Fire Incident Reporting System (NFIRS) incidents
- Incident types reported to NFIRS in Gibsonville, NC
- 2,94440.4%Rescue & EMS
- 1,45520.0%Fire
- 86311.9%Good Intent Call
- 82311.3%Service Call
- 81911.2%False Alarm
- 3204.4%Hazardous Condition
- 380.5%Severe Weather
- 150.2%Overpressure Rupture
- Fire incident types reported to NFIRS in Gibsonville, NC
- 71549.1%Structure Fires
- 39927.4%Outside Fires
- 24416.8%Other
- 976.7%Mobile Property/Vehicle Fires
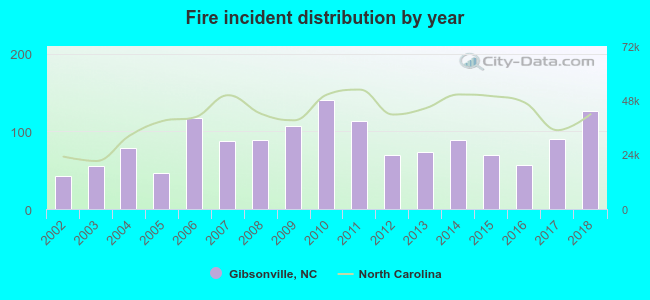 Based on the data from the years 2002 - 2018 the average number of fires per year is 86. The highest number of reported fires - 140 took place in 2010, and the least - 43 in 2002. The data has a growing trend.
The average number of yearly fire incidents per 10k residents in Gibsonville, NC compared to nearest cities:
(Note: Based on data for the last 3 years, including only cities with population 5,000 and above)
| Gibsonville: | 135.9 |
| Elon: | 49.2 |
| Burlington: | 55.4 |
| Graham: | 45.8 |
| Mebane: | 102.7 |
| Greensboro: | 33.0 |
| Reidsville: | 108.2 |
| Summerfield: | 41.2 |
| Hillsborough: | 146.6 |
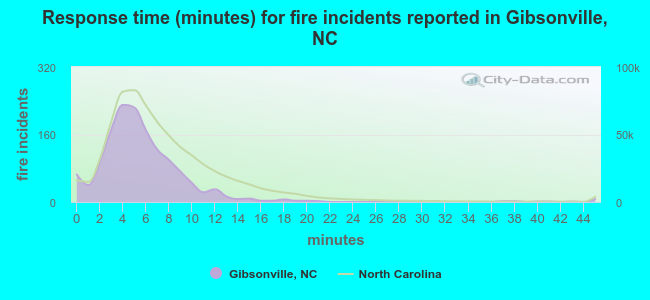 The median response time based on all reported fire incidents is 5 minutes. This is lower than the North Carolina median value.
The median response time in Gibsonville, NC compared to nearest cities:
(Note: Based on data for all years, including only cities with at least 500 fire incidents)
| Gibsonville: | 5 minutes |
| Elon: | 6 minutes |
| Whitsett: | 6 minutes |
| Burlington: | 5 minutes |
| McLeansville: | 6 minutes |
| Graham: | 6 minutes |
| Mebane: | 7 minutes |
| Greensboro: | 4 minutes |
| Pleasant Garden: | 6 minutes |
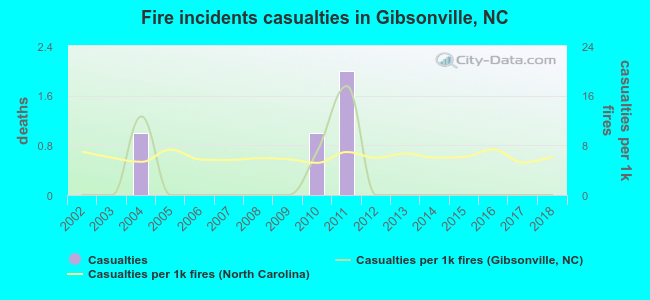 Based on the reports from the years 2002 - 2018 the average number of fire-related yearly casualties is 0. The highest number of injuries - 2 took place in 2011, and the lowest - 0 in 2002. The data has a constant trend.
The average number of injuries per 1,000 fires is 2. This indicator was the highest - 18 in 2011, and the lowest 0 in 2002. The trend for injuries per 1,000 fire incidents is constant. Compared to the North Carolina value the number of casualties per 1,000 fires is much lower.
Based on the reports from the years 2002 - 2018 the average number of fire-related yearly casualties is 0. The highest number of injuries - 2 took place in 2011, and the lowest - 0 in 2002. The data has a constant trend.
The average number of injuries per 1,000 fires is 2. This indicator was the highest - 18 in 2011, and the lowest 0 in 2002. The trend for injuries per 1,000 fire incidents is constant. Compared to the North Carolina value the number of casualties per 1,000 fires is much lower.Casualties per 1,000 incidents in Gibsonville, NC compared to nearest cities:
(Note: Based on data for all years, including only cities with at least 500 fire incidents)
| Gibsonville: | 2.7 |
| Elon: | 12.8 |
| Whitsett: | 2.9 |
| Burlington: | 6.4 |
| McLeansville: | 2.3 |
| Graham: | 1.5 |
| Mebane: | 8.1 |
| Greensboro: | 12.2 |
| Pleasant Garden: | 4.2 |
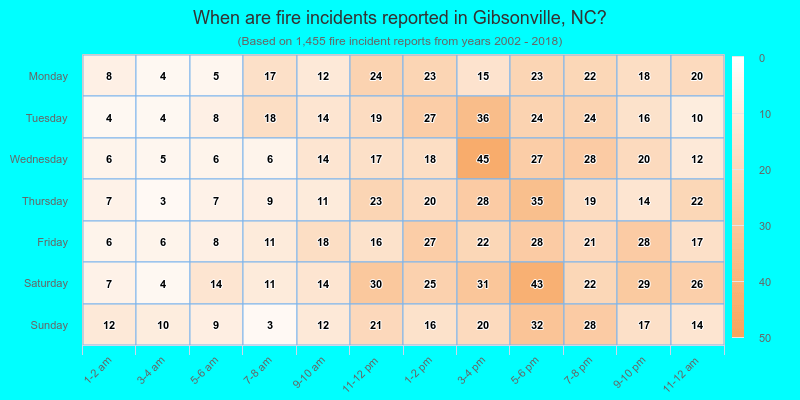
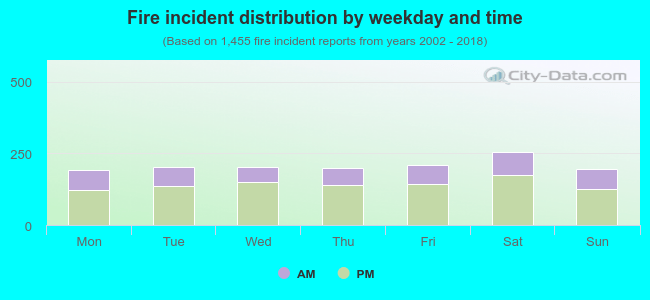 31.8% incidents where reported in the morning and 68.2% in the evening. The most fires (17.6%) took place on Saturday, and the least (13.1%) on Monday.
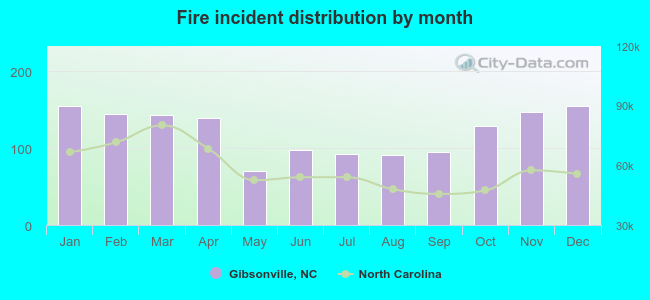 According to the 1,455 reports from years 2002 - 2018 most fires (10.7%) took place during January, and the least (4.8%) in May.
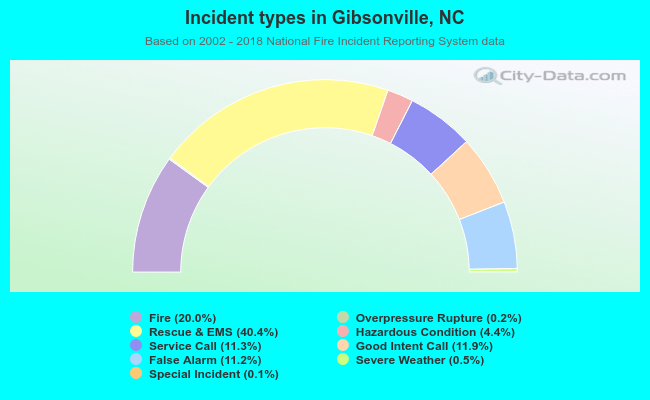 Out of all 7,281 cases reported during the years 2002 - 2018, the most belonged to the categories: Rescue & EMS (40.4%), Fire (20.0%), and Good Intent Call (11.9%).
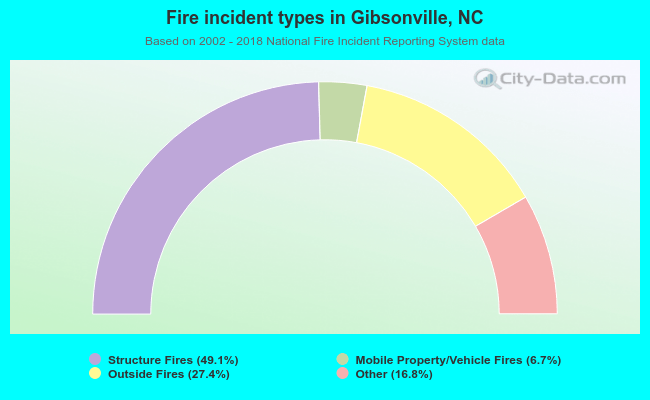 When looking into fire subcategories, the most incidents belonged to: Structure Fires (49.1%), and Outside Fires (27.4%).