Mebane: Fire Incidents, North Carolina (NC)
Where are fire incidents reported in Mebane, NC
Something went wrong! Please refresh the page.
| Fire incidents reported | |
|---|---|
| Sreet name | Count |
| MEBANE OAKS RD | 138 |
| US 70 HWY | 128 |
| TROLLINGWOOD HAWFIELDS RD | 126 |
| NC 119 HWY | 110 |
| FIFTH ST | 96 |
| BUCKHORN RD | 76 |
| CENTER ST | 58 |
| MILL CREEK RD | 56 |
| THIRD ST | 54 |
| WASHINGTON ST | 54 |
| 119 HWY | 52 |
| STONE STREET EXT | 52 |
| FRAZIER RD | 50 |
| I-85 HWY | 48 |
| DEERFIELD TRCE | 46 |
| 70 HWY | 44 |
| CALLOWAY DR | 40 |
| HOLT ST | 40 |
| LEBANON RD | 40 |
| OAKWOOD ST | 40 |
| EDGEWOOD CHURCH RD | 38 |
| I85 HWY | 38 |
| I85/40 HWY | 38 |
| LYNCH STORE RD | 38 |
| DOGWOOD WAY | 34 |
| GIBSON RD | 34 |
| CARR ST | 30 |
| FARRELL RD | 30 |
| FIRST ST | 30 |
| INTERSTATE 85 HWY | 30 |
| Other | 526 |
2002 - 2018 National Fire Incident Reporting System (NFIRS) incidents
- Incident types reported to NFIRS in Mebane, NC
- 9,16056.8%Rescue & EMS
- 2,21413.7%Fire
- 1,75810.9%Good Intent Call
- 1,1537.2%False Alarm
- 1,0036.2%Hazardous Condition
- 7474.6%Service Call
- 530.3%Severe Weather
- 240.1%Overpressure Rupture
- Fire incident types reported to NFIRS in Mebane, NC
- 88540.0%Outside Fires
- 87639.6%Structure Fires
- 40418.2%Mobile Property/Vehicle Fires
- 492.2%Other
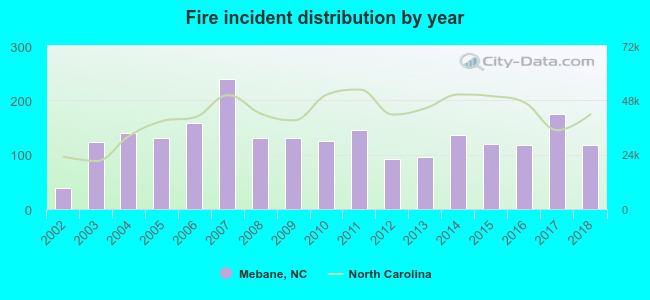 According to the data from the years 2002 - 2018 the average number of fires per year is 130. The highest number of fire incidents - 239 took place in 2007, and the least - 39 in 2002. The data has a rising trend.
The average number of yearly fire incidents per 10k residents in Mebane, NC compared to nearest cities:
(Note: Based on data for the last 3 years, including only cities with population 5,000 and above)
| Mebane: | 102.7 |
| Graham: | 45.8 |
| Hillsborough: | 146.6 |
| Burlington: | 55.4 |
| Elon: | 49.2 |
| Gibsonville: | 135.9 |
| Carrboro: | 29.5 |
| Chapel Hill: | 39.1 |
| Durham: | 32.5 |
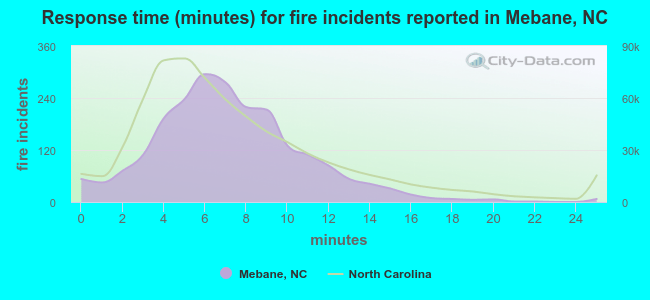 The median response time based on all reported fire incidents is 7 minutes. This is about the same as the North Carolina median value.
The median response time in Mebane, NC compared to nearest cities:
(Note: Based on data for all years, including only cities with at least 500 fire incidents)
| Mebane: | 7 minutes |
| Graham: | 6 minutes |
| Hillsborough: | 8 minutes |
| Burlington: | 5 minutes |
| Elon: | 6 minutes |
| Gibsonville: | 5 minutes |
| Carrboro: | 4 minutes |
| Whitsett: | 6 minutes |
| Chapel Hill: | 5 minutes |
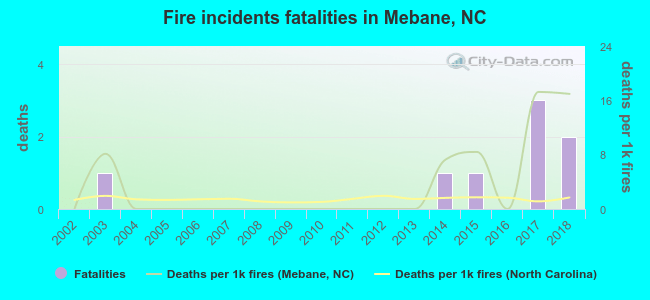 Based on the reports from the years 2002 - 2018 the average number of fire-related yearly deaths is 0. The highest number of reported deaths - 3 took place in 2017, and the lowest - 0 in 2002. The data has a growing trend.
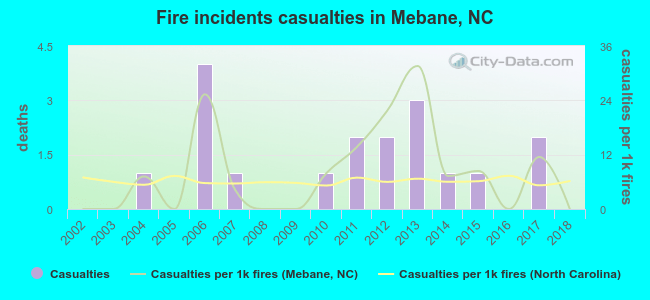 According to the reports from the years 2002 - 2018 the average number of fire-related yearly casualties is 1. The highest number of reported casualties - 4 took place in 2006, and the lowest - 0 in 2002. The data has a constant trend.
The average number of casualties per 1,000 fires is 8. This indicator was the highest - 32 in 2013, and the lowest 0 in 2002. The trend for casualties per 1,000 incidents is constant. Compared to the North Carolina value the number of casualties per 1,000 fire incidents is higher.
According to the reports from the years 2002 - 2018 the average number of fire-related yearly casualties is 1. The highest number of reported casualties - 4 took place in 2006, and the lowest - 0 in 2002. The data has a constant trend.
The average number of casualties per 1,000 fires is 8. This indicator was the highest - 32 in 2013, and the lowest 0 in 2002. The trend for casualties per 1,000 incidents is constant. Compared to the North Carolina value the number of casualties per 1,000 fire incidents is higher.Casualties per 1,000 incidents in Mebane, NC compared to nearest cities:
(Note: Based on data for all years, including only cities with at least 500 fire incidents)
| Mebane: | 8.1 |
| Graham: | 1.5 |
| Hillsborough: | 1.4 |
| Burlington: | 6.4 |
| Elon: | 12.8 |
| Gibsonville: | 2.7 |
| Carrboro: | 17.5 |
| Whitsett: | 2.9 |
| Chapel Hill: | 13.5 |
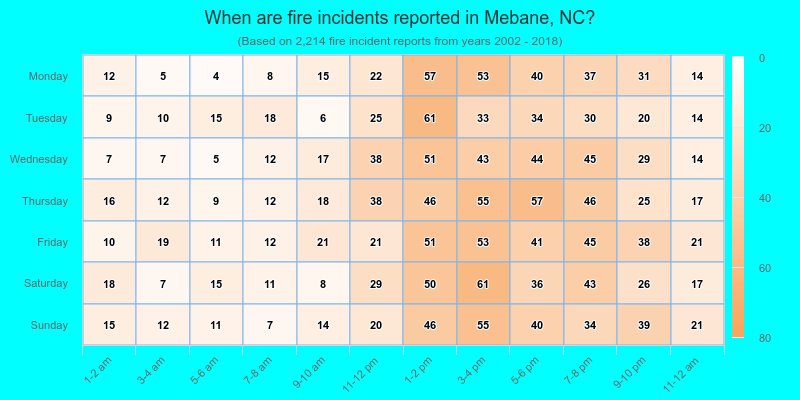
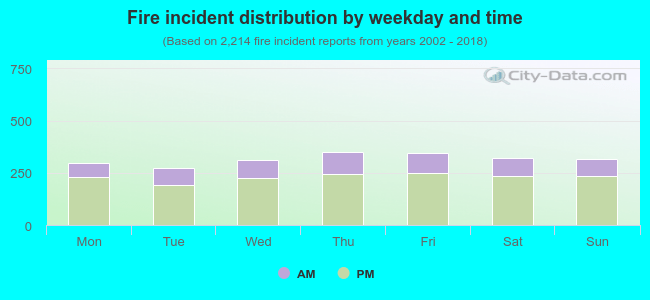 27.1% incidents where reported in the morning and 72.9% in the evening. The most fires (15.9%) took place on Thursday, and the least (12.4%) on Tuesday.
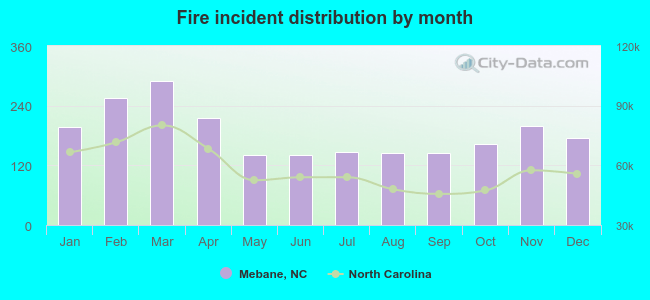 According to the 2,214 fire incidents from years 2002 - 2018 most fires (13.1%) took place during March, and the least (6.4%) in May.
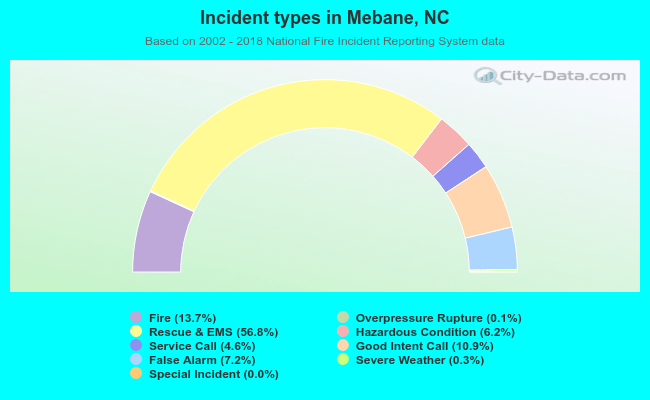 Out of all 16,119 cases reported during the years 2002 - 2018, the most belonged to the categories: Rescue & EMS (56.8%), Fire (13.7%), and Good Intent Call (10.9%).
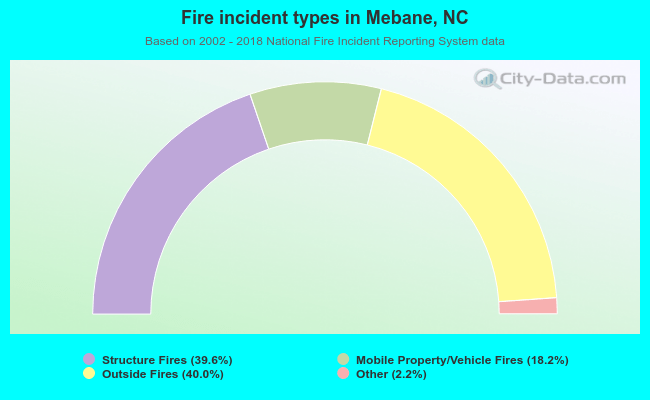 When looking into fire subcategories, the most reports belonged to: Outside Fires (40.0%), and Structure Fires (39.6%).