Bayville: Fire Incidents, New York (NY)
Where are fire incidents reported in Bayville, NY
Something went wrong! Please refresh the page.
|
| |||||||||||||||||||||||||||||||||||||||||||||||||||||||||||||||||||||||||||||||||||||||||||||||||||||||||||||
2006 - 2018 National Fire Incident Reporting System (NFIRS) incidents
- Incident types reported to NFIRS in Bayville, NY
- 1,62166.4%Rescue & EMS
- 30112.3%False Alarm
- 28011.5%Hazardous Condition
- 1295.3%Fire
- 753.1%Service Call
- 281.1%Good Intent Call
- 50.2%Overpressure Rupture
- 30.1%Special Incident
- Fire incident types reported to NFIRS in Bayville, NY
- 7961.2%Structure Fires
- 4434.1%Outside Fires
- 43.1%Other
- 21.6%Mobile Property/Vehicle Fires
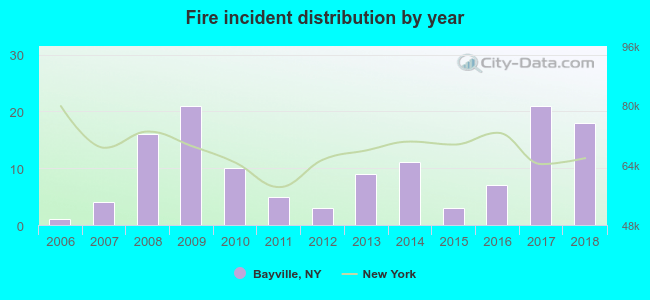 According to the data from the years 2006 - 2018 the average number of fires per year is 10. The highest number of reported fire incidents - 21 took place in 2009, and the least - 1 in 2006. The data has a growing trend.
The average number of yearly fire incidents per 10k residents in Bayville, NY compared to nearest cities:
(Note: Based on data for the last 3 years, including only cities with population 5,000 and above)
| Bayville: | 22.7 |
| Oyster Bay: | 13.9 |
| Glen Cove: | 21.1 |
| Sea Cliff: | 10.6 |
| Cold Spring Harbor: | 4.6 |
| Syosset: | 19.8 |
| Huntington: | 8.7 |
| Woodbury: | 23.2 |
| Rye: | 23.8 |
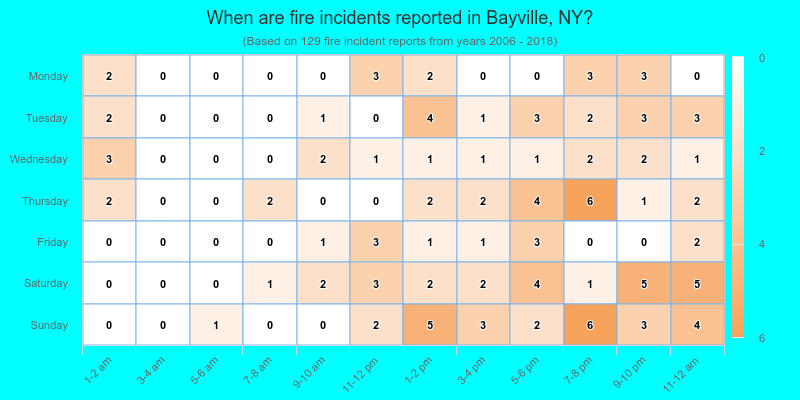
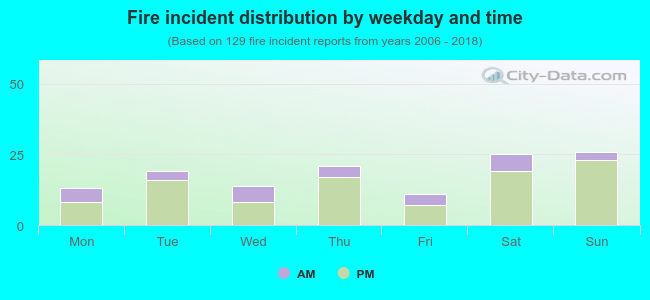 24.0% incidents where reported in the morning and 76.0% in the evening. The most fires (20.2%) took place on Sunday, and the least (8.5%) on Friday.
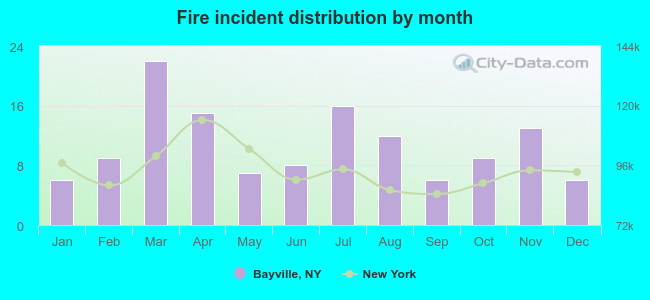 According to the 129 reports from years 2006 - 2018 most fires (17.1%) took place during March, and the least (4.7%) in January.
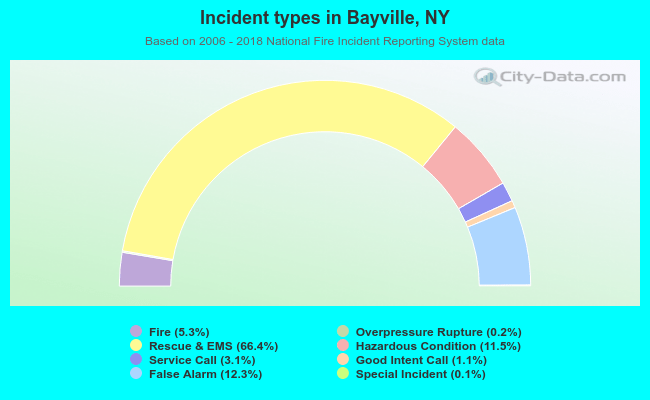 Out of all 2,442 cases reported during the years 2006 - 2018, the most belonged to the categories: Rescue & EMS (66.4%), False Alarm (12.3%), and Hazardous Condition (11.5%).
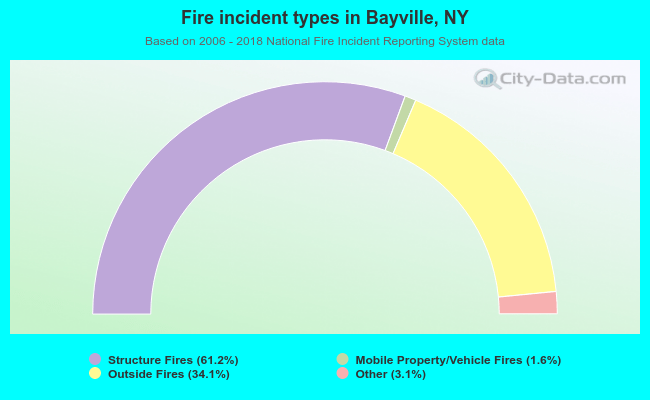 When looking into fire subcategories, the most incidents belonged to: Structure Fires (61.2%), and Outside Fires (34.1%).