Glenview: Fire Incidents, Illinois (IL)
Where are fire incidents reported in Glenview, IL
Something went wrong! Please refresh the page.
| Fire incidents reported | |
|---|---|
| Sreet name | Count |
| WAUKEGAN RD | 170 |
| WILLOW RD | 100 |
| WEST LAKE AVE | 92 |
| GLENVIEW RD | 90 |
| MILWAUKEE AVE | 78 |
| CENTRAL RD | 58 |
| DEARLOVE RD | 58 |
| PATRIOT BLVD | 54 |
| GREENWOOD RD | 52 |
| PFINGSTEN RD | 48 |
| LEHIGH AVE | 44 |
| TRISTATE | 44 |
| MILWAUKEE AV | 38 |
| MICHAEL TODD TER | 36 |
| TRI-STATE TOLLWAY | 32 |
| WEST LAKE AV | 30 |
| EAST LAKE AVE | 28 |
| HENLEY ST | 28 |
| GOLF RD | 26 |
| SALEM WALK | 26 |
| SHERMER RD | 26 |
| LINNEMAN ST | 24 |
| CASTILIAN CT | 22 |
| GLENSHIRE RD | 22 |
| HARMS RD | 22 |
| TRIUMVERA DR | 22 |
| CHESTNUT AVE | 20 |
| HARLEM AVE | 20 |
| COVE LN | 18 |
| TOWER DR | 18 |
| Other | 218 |
2002 - 2018 National Fire Incident Reporting System (NFIRS) incidents
- Incident types reported to NFIRS in Glenview, IL
- 19,90951.9%Rescue & EMS
- 7,07218.4%False Alarm
- 4,44211.6%Service Call
- 3,90910.2%Hazardous Condition
- 1,5644.1%Fire
- 1,3673.6%Good Intent Call
- 530.1%Overpressure Rupture
- 440.1%Severe Weather
- Fire incident types reported to NFIRS in Glenview, IL
- 61839.5%Structure Fires
- 54034.5%Outside Fires
- 24215.5%Mobile Property/Vehicle Fires
- 16410.5%Other
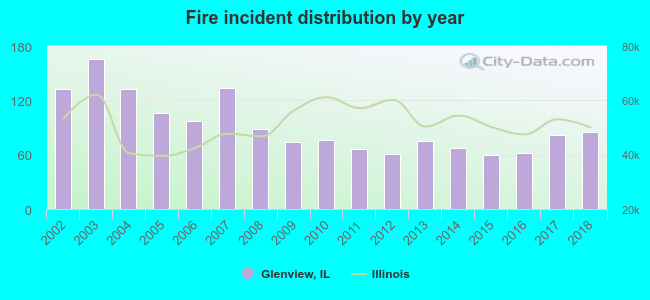 Based on the data from the years 2002 - 2018 the average number of fires per year is 92. The highest number of fires - 166 took place in 2003, and the least - 60 in 2015. The data has a dropping trend.
The average number of yearly fire incidents per 10k residents in Glenview, IL compared to nearest cities:
(Note: Based on data for the last 3 years, including only cities with population 5,000 and above)
| Glenview: | 16.3 |
| Northfield: | 21.0 |
| Morton Grove: | 14.8 |
| Niles: | 20.0 |
| Northbrook: | 21.9 |
| Winnetka: | 20.8 |
| Glencoe: | 7.8 |
| Wilmette: | 19.7 |
| Park Ridge: | 14.3 |
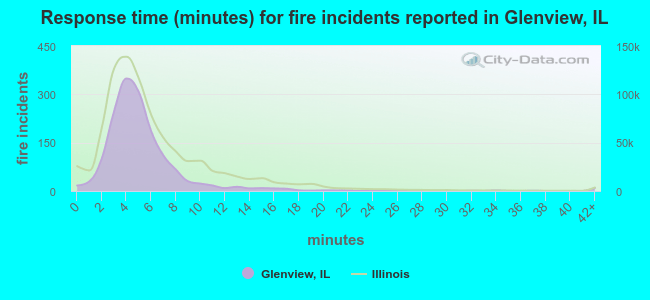 The median response time based on all reported fire incidents is 5 minutes. This is about the same as the state median value.
The median response time in Glenview, IL compared to nearest cities:
(Note: Based on data for all years, including only cities with at least 500 fire incidents)
| Glenview: | 5 minutes |
| Morton Grove: | 4 minutes |
| Niles: | 4 minutes |
| Northbrook: | 5 minutes |
| Winnetka: | 4 minutes |
| Wilmette: | 4 minutes |
| Park Ridge: | 5 minutes |
| Skokie: | 5 minutes |
| Des Plaines: | 5 minutes |
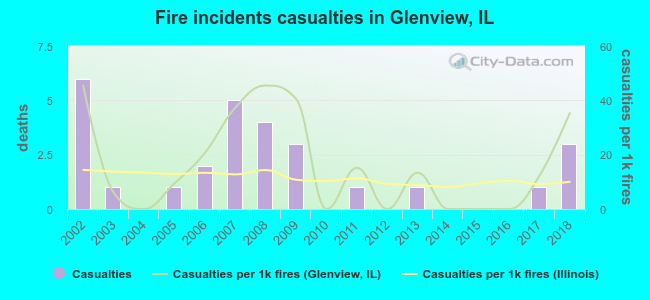 According to the data from the years 2002 - 2018 the average number of fire-related yearly casualties is 2. The highest number of reported casualties - 6 took place in 2002, and the lowest - 0 in 2004. The data has a decreasing trend.
The average number of casualties per 1,000 fire incidents is 17. This indicator was the highest - 45 in 2002, and the lowest 0 in 2004. The trend for casualties per 1,000 fires is decreasing. Compared to the state value the number of casualties per 1,000 fire incidents is higher.
According to the data from the years 2002 - 2018 the average number of fire-related yearly casualties is 2. The highest number of reported casualties - 6 took place in 2002, and the lowest - 0 in 2004. The data has a decreasing trend.
The average number of casualties per 1,000 fire incidents is 17. This indicator was the highest - 45 in 2002, and the lowest 0 in 2004. The trend for casualties per 1,000 fires is decreasing. Compared to the state value the number of casualties per 1,000 fire incidents is higher.Casualties per 1,000 incidents in Glenview, IL compared to nearest cities:
(Note: Based on data for all years, including only cities with at least 500 fire incidents)
| Glenview: | 17.9 |
| Morton Grove: | 3.5 |
| Niles: | 11.2 |
| Northbrook: | 17.2 |
| Winnetka: | 15.2 |
| Wilmette: | 5.0 |
| Park Ridge: | 16.8 |
| Skokie: | 21.4 |
| Des Plaines: | 37.0 |
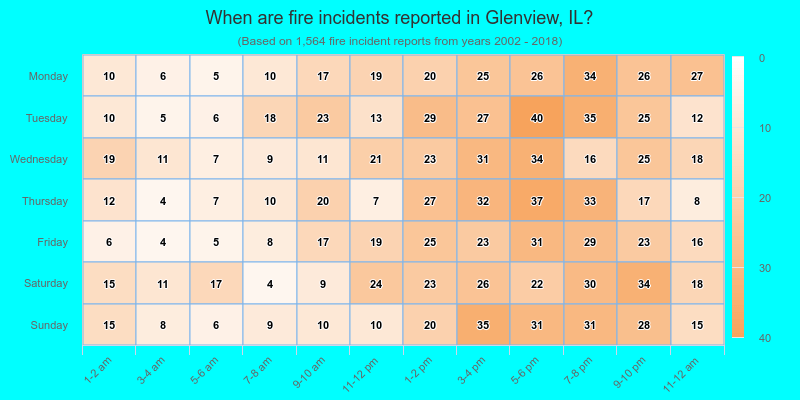
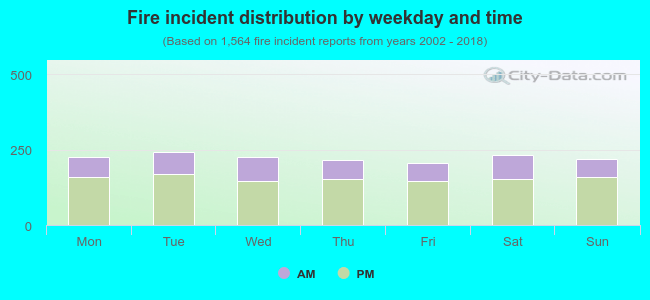 30.5% incidents where reported in the morning and 69.5% in the evening. The most fires (15.5%) took place on Tuesday, and the least (13.2%) on Friday.
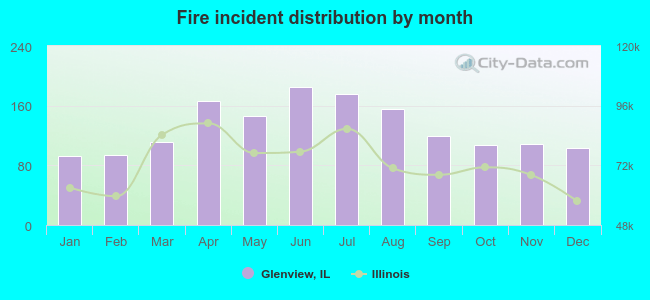 According to the 1,564 fires from years 2002 - 2018 most fires (11.8%) took place during June, and the least (5.9%) in January.
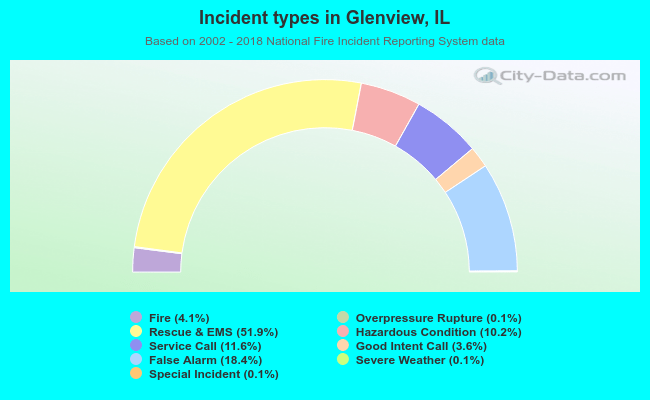 Out of all 38,381 cases reported during the years 2002 - 2018, the most belonged to the categories: Rescue & EMS (51.9%), False Alarm (18.4%), and Service Call (11.6%).
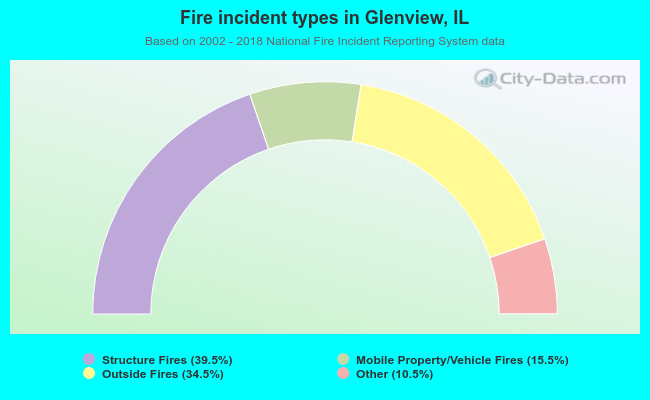 When looking into fire subcategories, the most reports belonged to: Structure Fires (39.5%), and Outside Fires (34.5%).