Northbrook: Fire Incidents, Illinois (IL)
Where are fire incidents reported in Northbrook, IL
Something went wrong! Please refresh the page.
| Fire incidents reported | |
|---|---|
| Sreet name | Count |
| DUNDEE RD | 226 |
| SHERMER RD | 146 |
| SKOKIE BV | 110 |
| WAUKEGAN RD | 106 |
| LAKE COOK RD | 96 |
| SKOKIE BLVD | 82 |
| TECHNY RD | 74 |
| PFINGSTEN RD | 70 |
| EDENS EW | 58 |
| WILLOW RD | 54 |
| LANDWEHR RD | 50 |
| WALTERS AV | 44 |
| MISSION HILLS RD | 42 |
| MILWAUKEE AVE | 40 |
| TRISTATE | 38 |
| SANDERS RD | 34 |
| OAKWOOD RD | 32 |
| TRISTATE TW | 32 |
| EDENS EXPY | 28 |
| OAK AV | 28 |
| COMMERCIAL AV | 24 |
| ILLINOIS RD | 24 |
| SALEM WALK | 24 |
| SKOKIE | 24 |
| ASH LN | 22 |
| MEADOW RD | 22 |
| REVERE DR | 22 |
| THE SPUR | 22 |
| TRI-STATE TW | 22 |
| WALTERS AVE | 22 |
| Other | 125 |
2002 - 2018 National Fire Incident Reporting System (NFIRS) incidents
- Incident types reported to NFIRS in Northbrook, IL
- 5,36923.6%Service Call
- 5,06722.3%False Alarm
- 4,94521.8%Rescue & EMS
- 3,65416.1%Hazardous Condition
- 1,8888.3%Good Intent Call
- 1,7437.7%Fire
- 450.2%Overpressure Rupture
- Fire incident types reported to NFIRS in Northbrook, IL
- 86649.7%Structure Fires
- 50729.1%Outside Fires
- 32118.4%Mobile Property/Vehicle Fires
- 492.8%Other
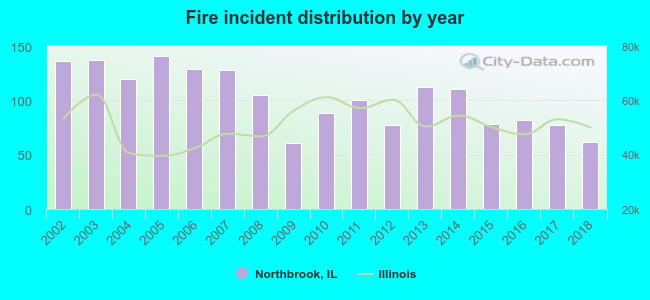 According to the data from the years 2002 - 2018 the average number of fires per year is 103. The highest number of fires - 141 took place in 2005, and the least - 61 in 2009. The data has a dropping trend.
The average number of yearly fire incidents per 10k residents in Northbrook, IL compared to nearest cities:
(Note: Based on data for the last 3 years, including only cities with population 5,000 and above)
| Northbrook: | 21.9 |
| Deerfield: | 26.5 |
| Glenview: | 16.3 |
| Northfield: | 21.0 |
| Highland Park: | 14.4 |
| Glencoe: | 7.8 |
| Wheeling: | 19.4 |
| Prospect Heights: | 27.4 |
| Highwood: | 11.8 |
 The median response time based on all reported fire incidents is 5 minutes. This is similar to the state median value.
The median response time in Northbrook, IL compared to nearest cities:
(Note: Based on data for all years, including only cities with at least 500 fire incidents)
| Northbrook: | 5 minutes |
| Deerfield: | 5 minutes |
| Glenview: | 5 minutes |
| Highland Park: | 4 minutes |
| Wheeling: | 5 minutes |
| Prospect Heights: | 5 minutes |
| Winnetka: | 4 minutes |
| Lincolnshire: | 4 minutes |
| Mount Prospect: | 5 minutes |
 According to the reports from the years 2002 - 2018 the average number of fire-related casualties per year is 2. The highest number of injuries - 5 took place in 2003, and the lowest - 0 in 2005. The data has a declining trend.
The average number of casualties per 1,000 fire incidents is 18. This indicator was the highest - 49 in 2009, and the lowest 0 in 2005. The trend for injuries per 1,000 incidents is declining. Compared to the Illinois value the number of casualties per 1,000 fires is higher.
According to the reports from the years 2002 - 2018 the average number of fire-related casualties per year is 2. The highest number of injuries - 5 took place in 2003, and the lowest - 0 in 2005. The data has a declining trend.
The average number of casualties per 1,000 fire incidents is 18. This indicator was the highest - 49 in 2009, and the lowest 0 in 2005. The trend for injuries per 1,000 incidents is declining. Compared to the Illinois value the number of casualties per 1,000 fires is higher.Casualties per 1,000 incidents in Northbrook, IL compared to nearest cities:
(Note: Based on data for all years, including only cities with at least 500 fire incidents)
| Northbrook: | 17.2 |
| Deerfield: | 16.6 |
| Glenview: | 17.9 |
| Highland Park: | 15.8 |
| Wheeling: | 57.3 |
| Prospect Heights: | 20.1 |
| Winnetka: | 15.2 |
| Lincolnshire: | 8.4 |
| Mount Prospect: | 28.0 |
 33.6% incidents where reported in the morning and 66.4% in the evening. The most fires (17.0%) took place on Monday, and the least (13.0%) on Thursday.
 Based on the 1,743 reports from years 2002 - 2018 most fires (12.4%) took place during July, and the least (5.9%) in December.
 Out of all 22,729 cases reported during the years 2002 - 2018, the most belonged to the categories: Service Call (23.6%), False Alarm (22.3%), and Rescue & EMS (21.8%).
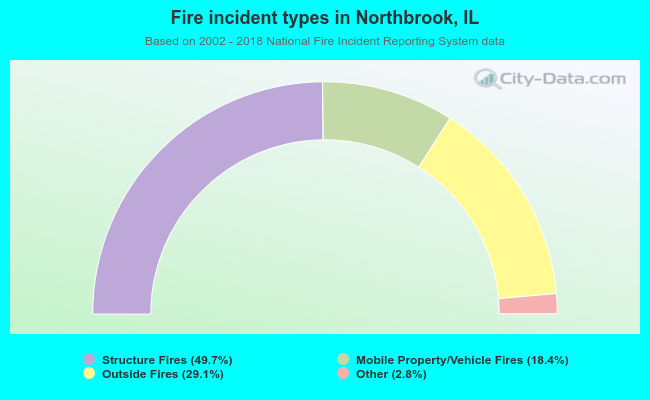 When looking into fire subcategories, the most incidents belonged to: Structure Fires (49.7%), and Outside Fires (29.1%).