Winnetka: Fire Incidents, Illinois (IL)
Where are fire incidents reported in Winnetka, IL
Something went wrong! Please refresh the page.
| Fire incidents reported | |
|---|---|
| Sreet name | Count |
| GREEN BAY RD | 96 |
| ELM ST | 62 |
| SHERIDAN RD | 48 |
| WILLOW RD | 42 |
| OAK ST | 40 |
| WINNETKA AVE | 40 |
| TOWER RD | 38 |
| CHESTNUT ST | 24 |
| CHERRY ST | 22 |
| INDIAN HILL RD | 22 |
| LINCOLN AVE | 20 |
| PRIVATE RD | 20 |
| SUNSET RD | 20 |
| ASH ST | 18 |
| LINDEN ST | 18 |
| SPRUCE ST | 18 |
| HIBBARD RD | 16 |
| PINE ST | 16 |
| FOREST WAY DR | 14 |
| FOXDALE AVE | 14 |
| WOODLEY RD | 14 |
| DE WINDT RD | 12 |
| FOREST GLEN DR | 12 |
| GAGE ST | 12 |
| HILL RD | 12 |
| LINCOLN AV | 12 |
| PINE TREE LN | 12 |
| ASBURY AVE | 10 |
| BERKELEY AVE | 10 |
| BRYANT AVE | 8 |
2002 - 2018 National Fire Incident Reporting System (NFIRS) incidents
- Incident types reported to NFIRS in Winnetka, IL
- 3,60329.7%Rescue & EMS
- 2,94724.3%False Alarm
- 1,93615.9%Good Intent Call
- 1,65113.6%Hazardous Condition
- 1,37011.3%Service Call
- 5914.9%Fire
- 350.3%Severe Weather
- Fire incident types reported to NFIRS in Winnetka, IL
- 40067.7%Structure Fires
- 13422.7%Outside Fires
- 315.2%Mobile Property/Vehicle Fires
- 264.4%Other
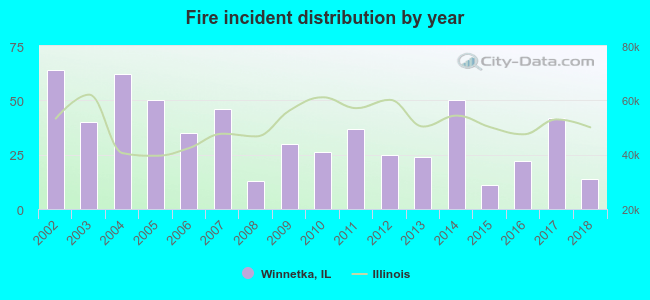 According to the data from the years 2002 - 2018 the average number of fires per year is 35. The highest number of fires - 64 took place in 2002, and the least - 11 in 2015. The data has a decreasing trend.
The average number of yearly fire incidents per 10k residents in Winnetka, IL compared to nearest cities:
(Note: Based on data for the last 3 years, including only cities with population 5,000 and above)
| Winnetka: | 20.8 |
| Northfield: | 21.0 |
| Glencoe: | 7.8 |
| Wilmette: | 19.7 |
| Glenview: | 16.3 |
| Evanston: | 15.6 |
| Skokie: | 12.6 |
| Morton Grove: | 14.8 |
| Northbrook: | 21.9 |
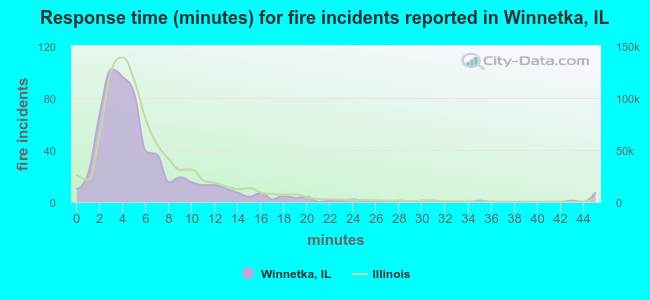 The median response time based on all reported fire incidents is 4 minutes. This is lower than the Illinois median value.
The median response time in Winnetka, IL compared to nearest cities:
(Note: Based on data for all years, including only cities with at least 500 fire incidents)
| Winnetka: | 4 minutes |
| Wilmette: | 4 minutes |
| Glenview: | 5 minutes |
| Evanston: | 4 minutes |
| Skokie: | 5 minutes |
| Morton Grove: | 4 minutes |
| Northbrook: | 5 minutes |
| Highland Park: | 4 minutes |
| Niles: | 4 minutes |
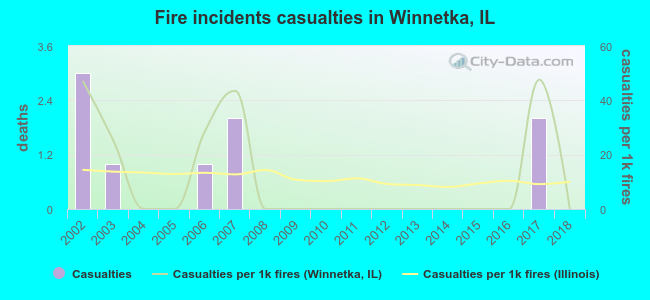 Based on the data from the years 2002 - 2018 the average number of fire-related casualties per year is 1. The highest number of reported casualties - 3 took place in 2002, and the lowest - 0 in 2004. The data has a decreasing trend.
The average number of injuries per 1,000 fires is 11. This indicator was the highest - 48 in 2017, and the lowest 0 in 2004. The trend for casualties per 1,000 fire incidents is declining. Compared to the Illinois value the number of injuries per 1,000 fires is higher.
Based on the data from the years 2002 - 2018 the average number of fire-related casualties per year is 1. The highest number of reported casualties - 3 took place in 2002, and the lowest - 0 in 2004. The data has a decreasing trend.
The average number of injuries per 1,000 fires is 11. This indicator was the highest - 48 in 2017, and the lowest 0 in 2004. The trend for casualties per 1,000 fire incidents is declining. Compared to the Illinois value the number of injuries per 1,000 fires is higher.Casualties per 1,000 incidents in Winnetka, IL compared to nearest cities:
(Note: Based on data for all years, including only cities with at least 500 fire incidents)
| Winnetka: | 15.2 |
| Wilmette: | 5.0 |
| Glenview: | 17.9 |
| Evanston: | 23.0 |
| Skokie: | 21.4 |
| Morton Grove: | 3.5 |
| Northbrook: | 17.2 |
| Highland Park: | 15.8 |
| Niles: | 11.2 |
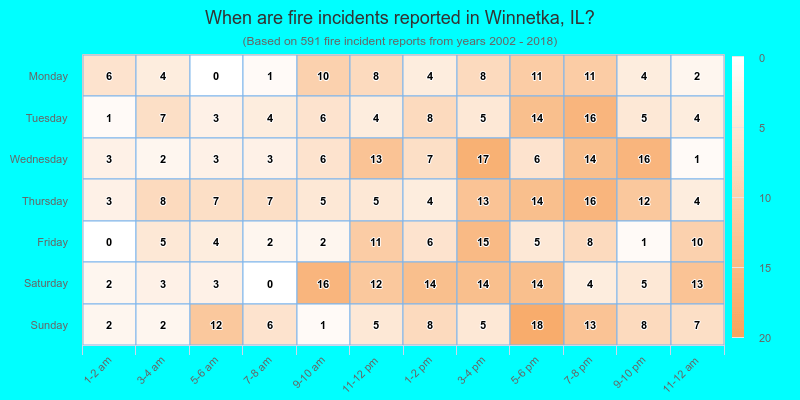
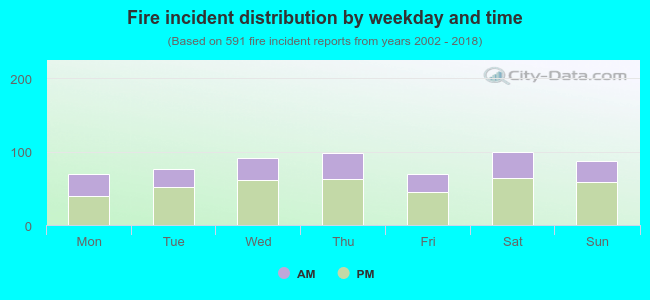 35.0% incidents where reported in the morning and 65.0% in the evening. The most fires (16.9%) took place on Saturday, and the least (11.7%) on Monday.
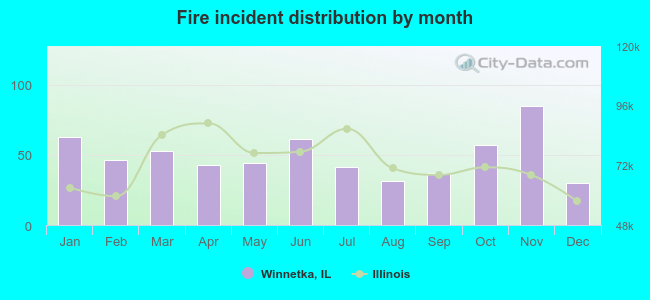 According to the 591 incident reports from years 2002 - 2018 most fires (14.4%) took place during November, and the least (5.1%) in December.
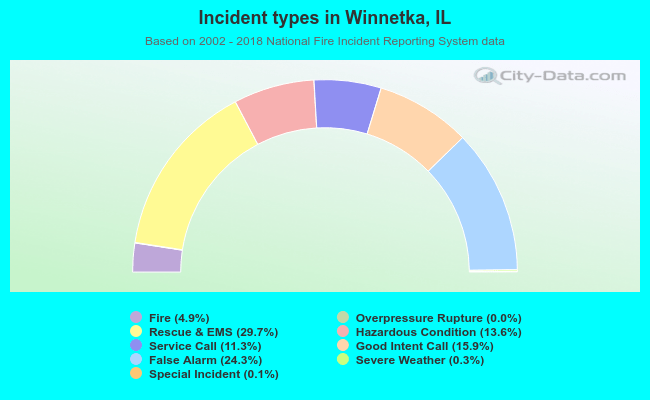 Out of all 12,147 cases reported during the years 2002 - 2018, the most belonged to the categories: Rescue & EMS (29.7%), False Alarm (24.3%), and Good Intent Call (15.9%).
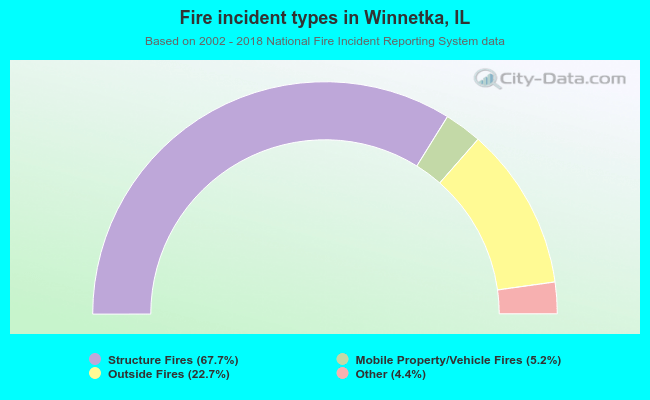 When looking into fire subcategories, the most incidents belonged to: Structure Fires (67.7%), and Outside Fires (22.7%).