Gloucester: Fire Incidents, Massachusetts (MA)
Where are fire incidents reported in Gloucester, MA
Something went wrong! Please refresh the page.
| Fire incidents reported | |
|---|---|
| Sreet name | Count |
| WASHINGTON ST | 322 |
| PROSPECT ST | 214 |
| ESSEX AVE | 176 |
| MAIN ST | 152 |
| WESTERN AVE | 88 |
| PLEASANT ST | 86 |
| MAPLEWOOD AVE | 70 |
| YANKEE DIVISION HWY | 58 |
| ROGERS ST | 56 |
| MIDDLE ST | 54 |
| VETERANS WAY | 54 |
| EASTERN AVE | 52 |
| MAGNOLIA AVE | 52 |
| CONCORD ST | 46 |
| RAILROAD AVE | 40 |
| EAST MAIN ST | 38 |
| HOUGH AVE | 38 |
| ATLANTIC ST | 34 |
| CHERRY ST | 34 |
| BASS AVE | 32 |
| CENTENNIAL AVE | 32 |
| E MAIN ST | 30 |
| CHESTNUT ST | 26 |
| DALE AVE | 26 |
| DORY RD | 26 |
| GLOUCESTER AVE | 26 |
| GREAT REPUBLIC DR | 26 |
| POND RD | 26 |
| ROCKY NECK AVE | 26 |
| SCHOOL ST | 26 |
| Other | 409 |
2002 - 2018 National Fire Incident Reporting System (NFIRS) incidents
- Incident types reported to NFIRS in Gloucester, MA
- 17,77554.4%Rescue & EMS
- 3,60711.0%Service Call
- 3,44310.5%False Alarm
- 2,7488.4%Hazardous Condition
- 2,5487.8%Good Intent Call
- 2,3757.3%Fire
- 1390.4%Special Incident
- Fire incident types reported to NFIRS in Gloucester, MA
- 1,25652.9%Structure Fires
- 78232.9%Outside Fires
- 1988.3%Mobile Property/Vehicle Fires
- 1395.9%Other
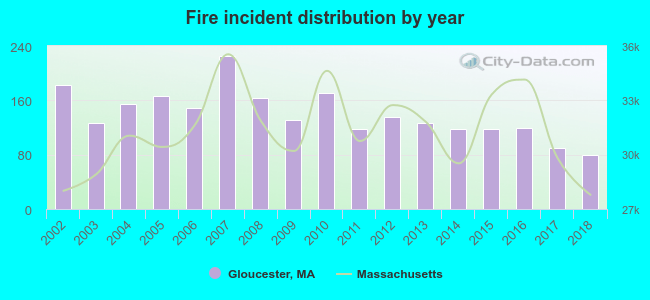 According to the data from the years 2002 - 2018 the average number of fire incidents per year is 140. The highest number of reported fire incidents - 225 took place in 2007, and the least - 79 in 2018. The data has a dropping trend.
The average number of yearly fire incidents per 10k residents in Gloucester, MA compared to nearest cities:
(Note: Based on data for the last 3 years, including only cities with population 5,000 and above)
| Gloucester: | 32.4 |
| Hamilton: | 21.5 |
| Beverly: | 25.5 |
| Marblehead: | 19.2 |
| Salem: | 37.4 |
| Danvers: | 40.5 |
| Newbury: | 30.5 |
| Swampscott: | 28.8 |
| Peabody: | 23.0 |
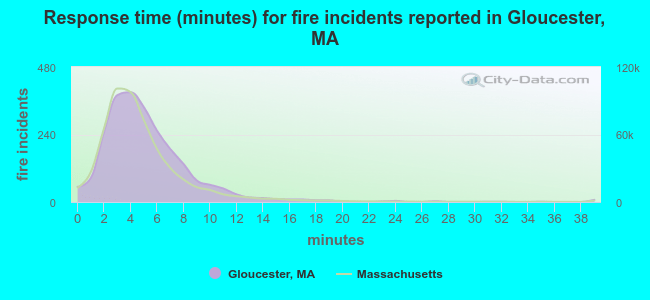 The median response time based on all reported fire incidents is 5 minutes. This is higher compared to the state median value.
The median response time in Gloucester, MA compared to nearest cities:
(Note: Based on data for all years, including only cities with at least 500 fire incidents)
| Gloucester: | 5 minutes |
| Ipswich: | 5 minutes |
| Hamilton: | 5 minutes |
| Beverly: | 4 minutes |
| Rowley: | 7 minutes |
| Marblehead: | 4 minutes |
| Salem: | 3 minutes |
| Danvers: | 5 minutes |
| Topsfield: | 4 minutes |
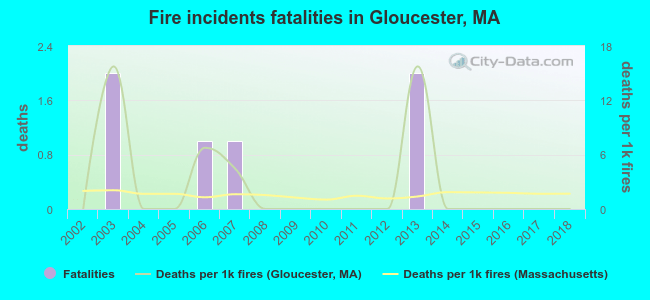 According to the reports from the years 2002 - 2018 the average number of fire-related yearly deaths is 0. The highest number of deaths - 2 took place in 2003, and the lowest - 0 in 2002. The data has a constant trend.
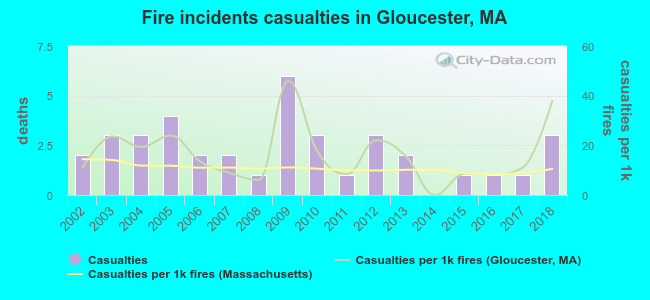 According to the reports from the years 2002 - 2018 the average number of fire-related yearly casualties is 2. The highest number of reported casualties - 6 took place in 2009, and the lowest - 0 in 2014. The data has a growing trend.
The average number of casualties per 1,000 fire incidents is 17. This indicator was the highest - 46 in 2009, and the lowest 0 in 2014. The trend for injuries per 1,000 fire incidents is rising. Compared to the state value the number of casualties per 1,000 incidents is higher.
According to the reports from the years 2002 - 2018 the average number of fire-related yearly casualties is 2. The highest number of reported casualties - 6 took place in 2009, and the lowest - 0 in 2014. The data has a growing trend.
The average number of casualties per 1,000 fire incidents is 17. This indicator was the highest - 46 in 2009, and the lowest 0 in 2014. The trend for injuries per 1,000 fire incidents is rising. Compared to the state value the number of casualties per 1,000 incidents is higher.
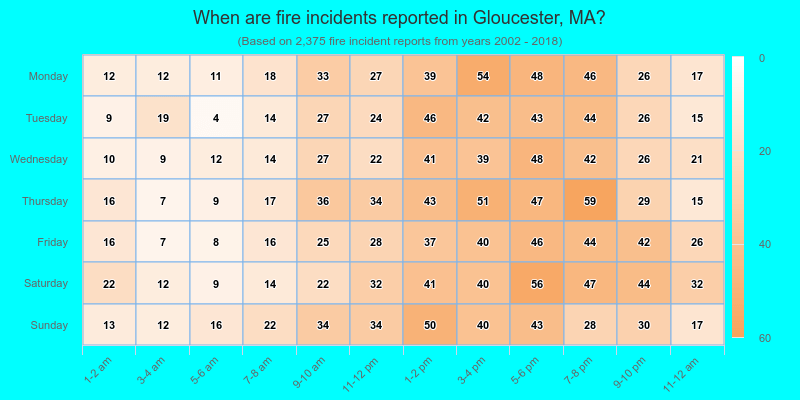
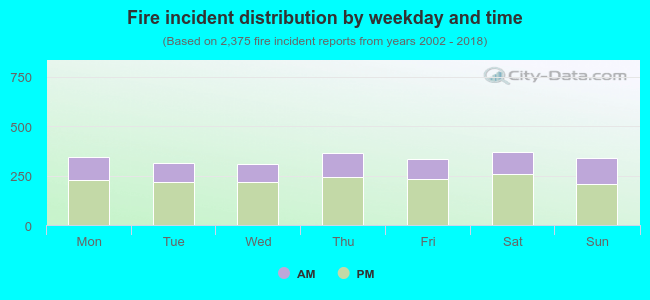 32.2% incidents where reported in the morning and 67.8% in the evening. The most fires (15.6%) took place on Saturday, and the least (13.1%) on Wednesday.
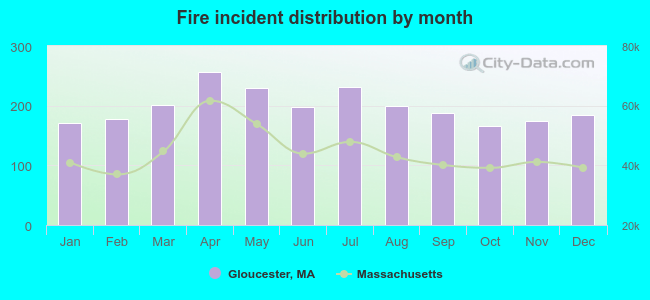 According to the 2,375 reports from years 2002 - 2018 most fires (10.8%) took place during April, and the least (7.0%) in October.
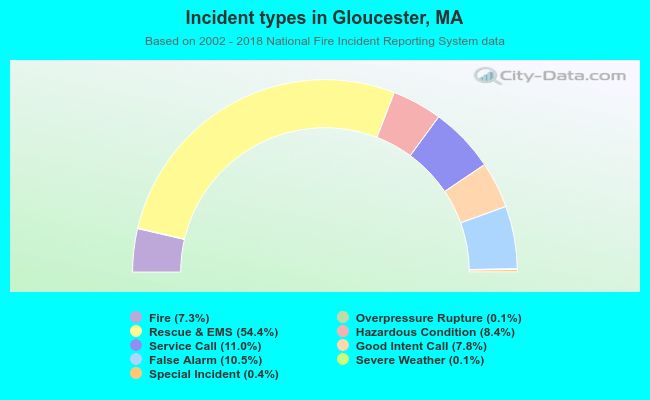 Out of all 32,683 cases reported during the years 2002 - 2018, the most belonged to the categories: Rescue & EMS (54.4%), Service Call (11.0%), and False Alarm (10.5%).
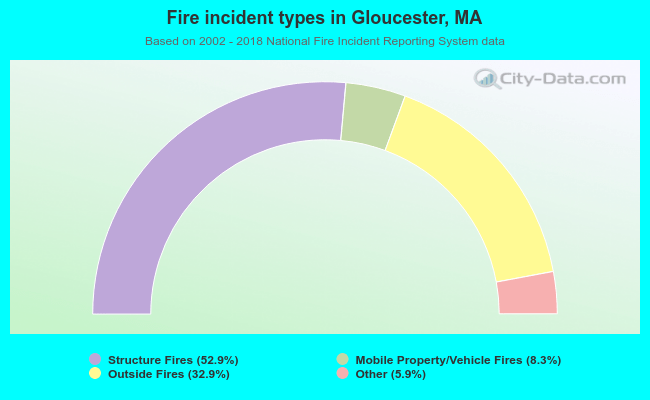 When looking into fire subcategories, the most reports belonged to: Structure Fires (52.9%), and Outside Fires (32.9%).