Hamilton: Fire Incidents, Massachusetts (MA)
Where are fire incidents reported in Hamilton, MA
Something went wrong! Please refresh the page.
| Fire incidents reported | |
|---|---|
| Sreet name | Count |
| BAY RD | 136 |
| ESSEX ST | 86 |
| HIGHLAND ST | 82 |
| BRIDGE ST | 54 |
| WALNUT RD | 54 |
| CHEBACCO RD | 36 |
| ASBURY ST | 34 |
| WILLOW ST | 32 |
| SAGAMORE ST | 30 |
| ECHO COVE RD | 24 |
| CUTLER RD | 22 |
| RUST ST | 20 |
| UNION ST | 20 |
| WOODLAND MEADE | 20 |
| WOODBURY ST | 18 |
| LAKE DR | 16 |
| LINDEN ST | 16 |
| RAILROAD AVE | 16 |
| WINTHROP ST | 16 |
| DONBYRNE WAY | 12 |
| GREENBROOK RD | 12 |
| HOMESTEAD CIR | 12 |
| MEYER RD | 12 |
| MOULTON ST | 12 |
| SCHOOL ST | 12 |
| ASBURY AVE | 10 |
| AUTUMN LN | 10 |
| DONALD RD | 10 |
| GARDNER ST | 10 |
| GREGORY ISLAND RD | 10 |
2002 - 2018 National Fire Incident Reporting System (NFIRS) incidents
- Incident types reported to NFIRS in Hamilton, MA
- 1,15828.5%False Alarm
- 1,06226.1%Hazardous Condition
- 60314.8%Fire
- 53813.2%Service Call
- 3268.0%Good Intent Call
- 3217.9%Rescue & EMS
- 270.7%Severe Weather
- 270.7%Special Incident
- Fire incident types reported to NFIRS in Hamilton, MA
- 38463.7%Structure Fires
- 17228.5%Outside Fires
- 274.5%Mobile Property/Vehicle Fires
- 203.3%Other
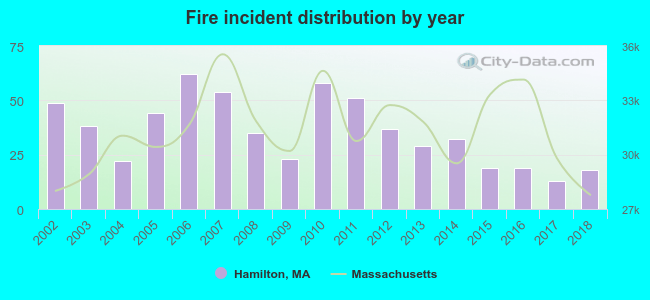 Based on the data from the years 2002 - 2018 the average number of fire incidents per year is 35. The highest number of reported fires - 62 took place in 2006, and the least - 13 in 2017. The data has a dropping trend.
The average number of yearly fire incidents per 10k residents in Hamilton, MA compared to nearest cities:
(Note: Based on data for the last 3 years, including only cities with population 5,000 and above)
| Hamilton: | 21.5 |
| Beverly: | 25.5 |
| Danvers: | 40.5 |
| Salem: | 37.4 |
| Peabody: | 23.0 |
| Middleton: | 34.9 |
| Marblehead: | 19.2 |
| Gloucester: | 32.4 |
| Georgetown: | 55.4 |
 The median response time based on all reported fire incidents is 5 minutes. This is higher compared to the state median value.
The median response time in Hamilton, MA compared to nearest cities:
(Note: Based on data for all years, including only cities with at least 500 fire incidents)
| Hamilton: | 5 minutes |
| Beverly: | 4 minutes |
| Ipswich: | 5 minutes |
| Topsfield: | 4 minutes |
| Danvers: | 5 minutes |
| Rowley: | 7 minutes |
| Salem: | 3 minutes |
| Boxford: | 8 minutes |
| Peabody: | 5 minutes |
 According to the data from the years 2002 - 2018 the average number of fire-related casualties per year is 0. The highest number of casualties - 2 took place in 2003, and the lowest - 0 in 2004. The data has a dropping trend.
The average number of casualties per 1,000 fires is 10. This indicator was the highest - 53 in 2003, and the lowest 0 in 2004. The trend for injuries per 1,000 fires is decreasing. Compared to the state value the number of injuries per 1,000 incidents is about the same.
According to the data from the years 2002 - 2018 the average number of fire-related casualties per year is 0. The highest number of casualties - 2 took place in 2003, and the lowest - 0 in 2004. The data has a dropping trend.
The average number of casualties per 1,000 fires is 10. This indicator was the highest - 53 in 2003, and the lowest 0 in 2004. The trend for injuries per 1,000 fires is decreasing. Compared to the state value the number of injuries per 1,000 incidents is about the same.
 26.0% incidents where reported in the morning and 74.0% in the evening. The most fires (17.6%) took place on Sunday, and the least (12.6%) on Friday.
 Based on the 603 incident reports from years 2002 - 2018 most fires (12.1%) took place during January, and the least (4.5%) in July.
 Out of all 4,062 cases reported during the years 2002 - 2018, the most belonged to the categories: Good Intent Call (28.5%), Rescue & EMS (26.1%), and Fire (14.8%).
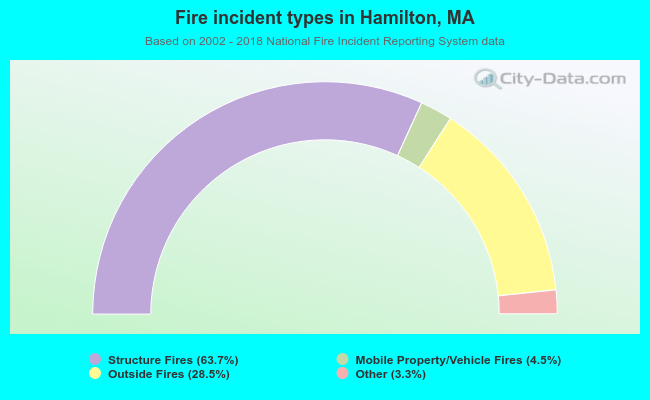 When looking into fire subcategories, the most reports belonged to: Structure Fires (63.7%), and Outside Fires (28.5%).