Port Washington: Fire Incidents, Wisconsin (WI)
Where are fire incidents reported in Port Washington, WI
Something went wrong! Please refresh the page.
|
| |||||||||||||||||||||||||||||||||||||||||||||||||||||||||||||||||||||||||||||||||||||||||||||||||||||||||||||
2002 - 2018 National Fire Incident Reporting System (NFIRS) incidents
- Incident types reported to NFIRS in Port Washington, WI
- 30925.9%False Alarm
- 29324.6%Hazardous Condition
- 28724.1%Fire
- 19816.6%Rescue & EMS
- 605.0%Service Call
- 373.1%Good Intent Call
- 60.5%Severe Weather
- Fire incident types reported to NFIRS in Port Washington, WI
- 15353.3%Structure Fires
- 8830.7%Outside Fires
- 4315.0%Mobile Property/Vehicle Fires
- 31.0%Other
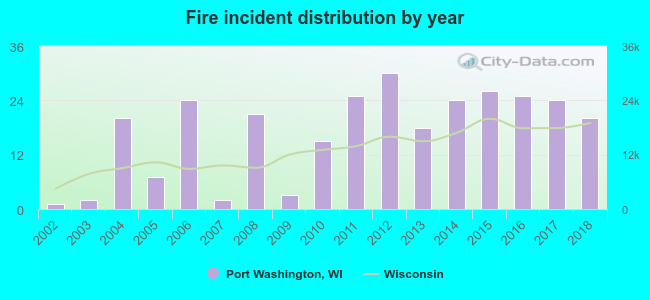 According to the data from the years 2002 - 2018 the average number of fires per year is 17. The highest number of reported fires - 30 took place in 2012, and the least - 1 in 2002. The data has a rising trend.
The average number of yearly fire incidents per 10k residents in Port Washington, WI compared to nearest cities:
(Note: Based on data for the last 3 years, including only cities with population 5,000 and above)
| Port Washington: | 19.9 |
| Grafton: | 15.9 |
| Cedarburg: | 15.9 |
| Mequon: | 6.0 |
| West Bend: | 28.4 |
| Jackson: | 27.4 |
| Brown Deer: | 13.5 |
| Fox Point: | 10.9 |
| Germantown: | 31.0 |
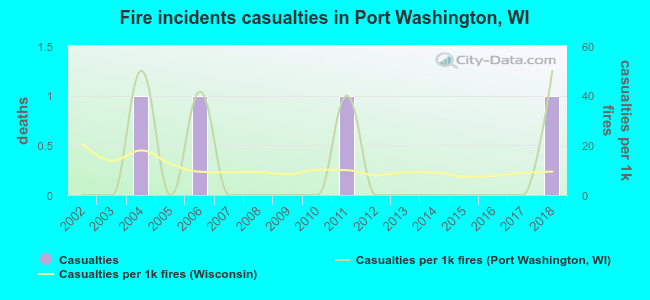 Based on the data from the years 2002 - 2018 the average number of fire-related casualties per year is 0. The highest number of reported injuries - 1 took place in 2004, and the lowest - 0 in 2002. The data has a rising trend.
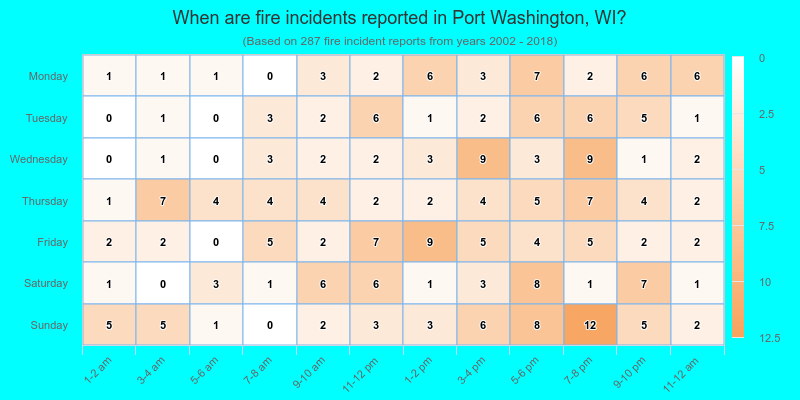
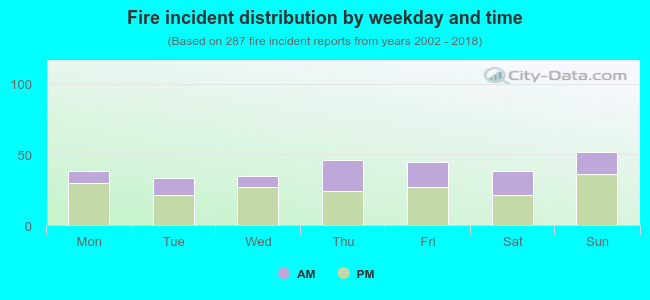 35.2% incidents where reported in the morning and 64.8% in the evening. The most fires (18.1%) took place on Sunday, and the least (11.5%) on Tuesday.
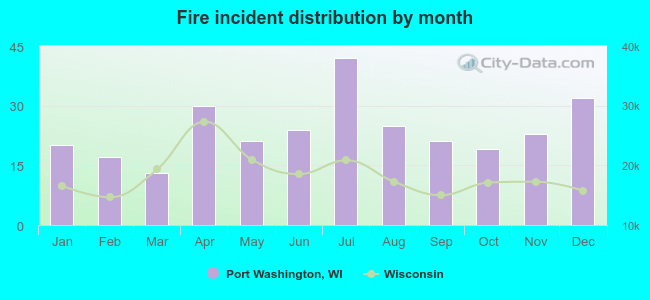 Based on the 287 reports from years 2002 - 2018 most fires (14.6%) took place during July, and the least (4.5%) in March.
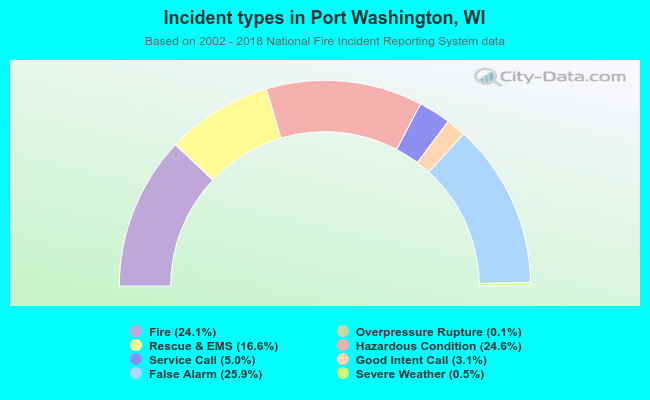 Out of all 1,191 cases reported during the years 2002 - 2018, the most belonged to the categories: False Alarm (25.9%), Hazardous Condition (24.6%), and Fire (24.1%).
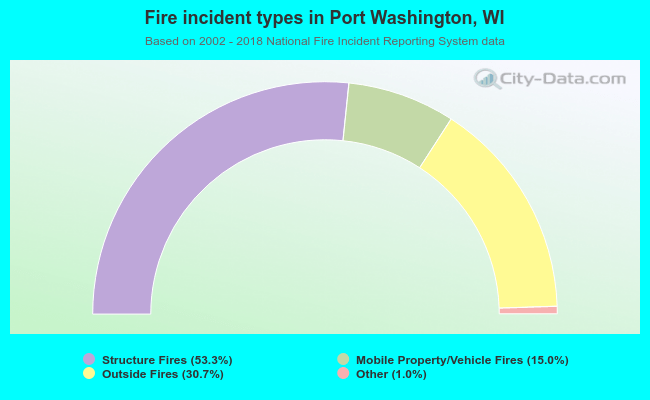 When looking into fire subcategories, the most incidents belonged to: Structure Fires (53.3%), and Outside Fires (30.7%).