Gretna: Fire Incidents, Louisiana (LA)
Where are fire incidents reported in Gretna, LA
Something went wrong! Please refresh the page.
| Fire incidents reported | |
|---|---|
| Sreet name | Count |
| WESTBANK EXPY | 254 |
| LAFAYETTE ST | 160 |
| GRETNA BLVD | 148 |
| CLAIRE AVE | 72 |
| STUMPF BLVD | 72 |
| BELLE CHASSE HWY | 66 |
| HANCOCK ST | 64 |
| NEWTON ST | 64 |
| HERO DR | 62 |
| HUEY P LONG AVE | 54 |
| 7TH ST | 44 |
| MONROE ST | 44 |
| 20TH ST | 40 |
| FRANKLIN AVE | 40 |
| VIRGIL ST | 38 |
| MADISON ST | 36 |
| STAFFORD ST | 36 |
| 1ST ST | 34 |
| DERBIGNY ST | 34 |
| DOLHONDE ST | 32 |
| ROMAIN ST | 32 |
| 4TH ST | 30 |
| 5TH ST | 30 |
| CLAIRE AVE. AVE | 26 |
| WHITNEY AVE | 26 |
| 8TH ST | 24 |
| CREAGAN AVE | 24 |
| FRANKLIN ST | 24 |
| MASON AVE | 22 |
| ROSE DR | 22 |
2002 - 2018 National Fire Incident Reporting System (NFIRS) incidents
- Incident types reported to NFIRS in Gretna, LA
- 1,27042.4%Fire
- 75825.3%Hazardous Condition
- 61820.6%False Alarm
- 1986.6%Good Intent Call
- 782.6%Service Call
- 531.8%Rescue & EMS
- 120.4%Special Incident
- 70.2%Overpressure Rupture
- Fire incident types reported to NFIRS in Gretna, LA
- 59847.1%Structure Fires
- 34026.8%Outside Fires
- 24719.4%Mobile Property/Vehicle Fires
- 856.7%Other
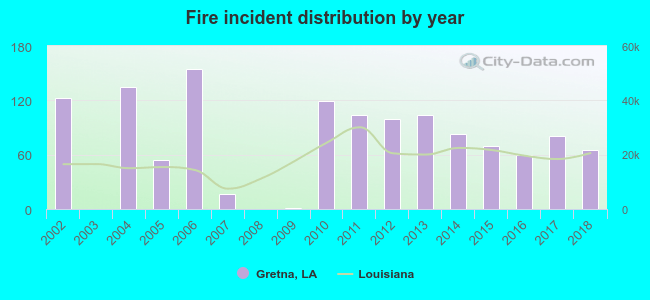 Based on the data from the years 2002 - 2018 the average number of fire incidents per year is 75. The highest number of fire incidents - 155 took place in 2006, and the least - 0 in 2003. The data has a decreasing trend.
The average number of yearly fire incidents per 10k residents in Gretna, LA compared to nearest cities:
(Note: Based on data for the last 3 years, including only cities with population 5,000 and above)
| Gretna: | 38.5 |
| Terrytown: | 46.7 |
| Harvey: | 77.3 |
| New Orleans: | 17.3 |
| Marrero: | 60.6 |
| Westwego: | 38.6 |
| Belle Chasse: | 59.7 |
| Chalmette: | 55.9 |
| Bridge City: | 23.4 |
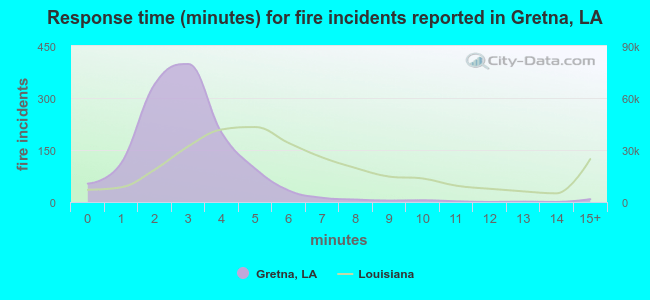 The median response time based on all reported fire incidents is 3 minutes. This is much lower compared to the Louisiana median value.
The median response time in Gretna, LA compared to nearest cities:
(Note: Based on data for all years, including only cities with at least 500 fire incidents)
| Gretna: | 3 minutes |
| Terrytown: | 4 minutes |
| Harvey: | 4 minutes |
| New Orleans: | 5 minutes |
| Marrero: | 4 minutes |
| Westwego: | 2 minutes |
| Belle Chasse: | 4 minutes |
| Chalmette: | 4 minutes |
| Jefferson: | 4 minutes |
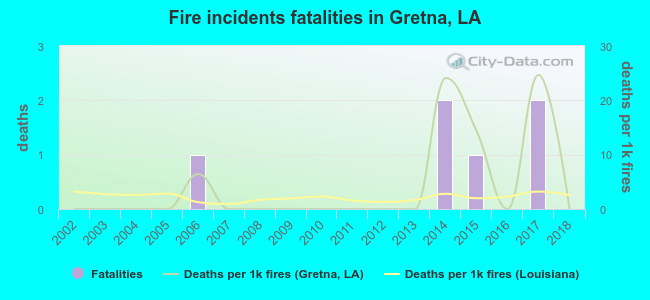 According to the reports from the years 2002 - 2018 the average number of fire-related fatalities per year is 0. The highest number of reported deaths - 2 took place in 2014, and the lowest - 0 in 2002. The data has a constant trend.
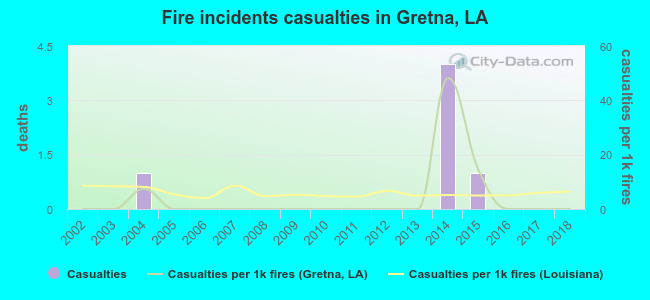 According to the reports from the years 2002 - 2018 the average number of fire-related casualties per year is 0. The highest number of reported casualties - 4 took place in 2014, and the lowest - 0 in 2002. The data has a constant trend.
The average number of casualties per 1,000 fire incidents is 4. This indicator was the highest - 48 in 2014, and the lowest 0 in 2002. The trend for injuries per 1,000 fire incidents is constant. Compared to the state value the number of casualties per 1,000 fires is lower.
According to the reports from the years 2002 - 2018 the average number of fire-related casualties per year is 0. The highest number of reported casualties - 4 took place in 2014, and the lowest - 0 in 2002. The data has a constant trend.
The average number of casualties per 1,000 fire incidents is 4. This indicator was the highest - 48 in 2014, and the lowest 0 in 2002. The trend for injuries per 1,000 fire incidents is constant. Compared to the state value the number of casualties per 1,000 fires is lower.Casualties per 1,000 incidents in Gretna, LA compared to nearest cities:
(Note: Based on data for all years, including only cities with at least 500 fire incidents)
| Gretna: | 4.7 |
| Terrytown: | 11.6 |
| Harvey: | 7.9 |
| New Orleans: | 3.7 |
| Marrero: | 3.4 |
| Westwego: | 7.5 |
| Belle Chasse: | 8.3 |
| Chalmette: | 12.5 |
| Jefferson: | 6.6 |
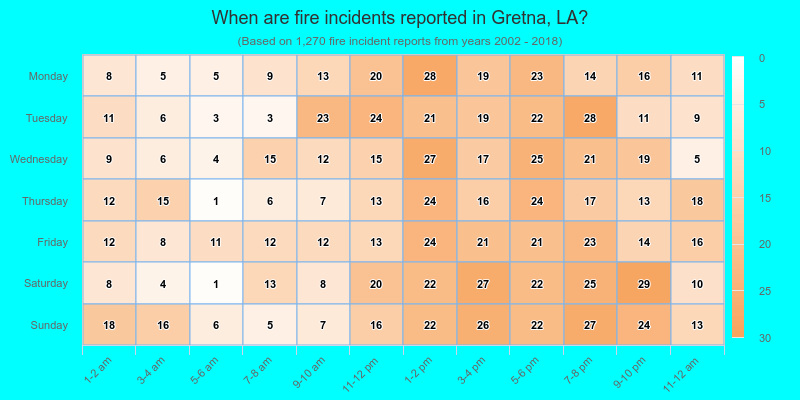
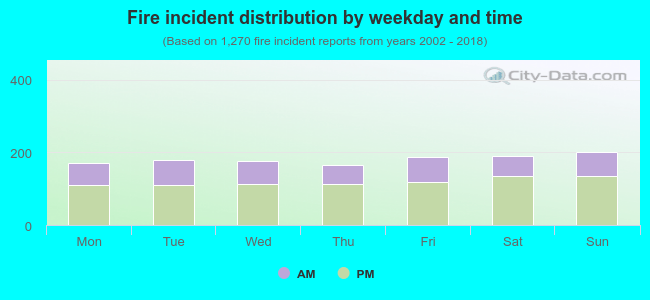 34.3% incidents where reported in the morning and 65.7% in the evening. The most fires (15.9%) took place on Sunday, and the least (13.1%) on Thursday.
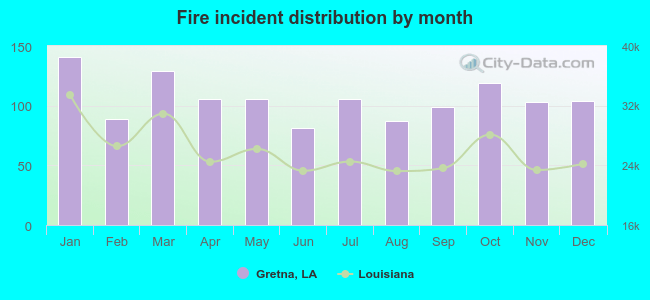 Based on the 1,270 incident reports from years 2002 - 2018 most fires (11.1%) took place during January, and the least (6.4%) in June.
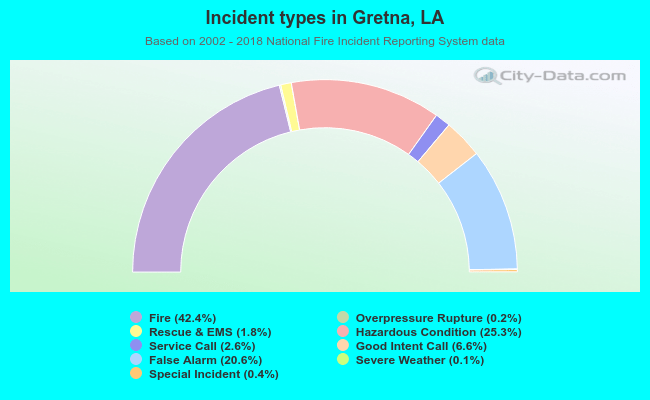 Out of all 2,996 cases reported during the years 2002 - 2018, the most belonged to the categories: Fire (42.4%), Hazardous Condition (25.3%), and False Alarm (20.6%).
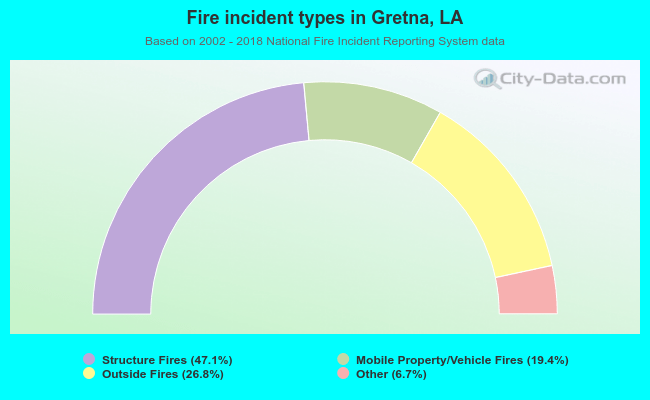 When looking into fire subcategories, the most incidents belonged to: Structure Fires (47.1%), and Outside Fires (26.8%).