Harvey: Fire Incidents, Louisiana (LA)
Where are fire incidents reported in Harvey, LA
Something went wrong! Please refresh the page.
| Fire incidents reported | |
|---|---|
| Sreet name | Count |
| MANHATTAN BLVD | 420 |
| LAPALCO BLVD | 184 |
| PETERS RD | 144 |
| DESTREHAN AVE | 140 |
| WESTBANK EXPY | 132 |
| ALEX KORNMAN BLVD | 102 |
| PAILET AVE | 62 |
| LAC BIENVILLE DR | 60 |
| DESTRAHAN AVE | 58 |
| TALLOWTREE LANE | 48 |
| TENSAS DR | 44 |
| BROWN AVE | 38 |
| MACARTHUR AVE | 38 |
| ESTALOTE AVE | 36 |
| LAC COUTURE DR | 36 |
| WOODMERE BLVD | 36 |
| EIGHTH ST | 32 |
| ESTHER ST | 32 |
| FRIENDSHIP DR | 32 |
| MELISSA DR | 32 |
| 3RD AVE | 30 |
| LORENE DR | 30 |
| WHITNEY AVE | 30 |
| 2ND AVE | 28 |
| ASPEN DR | 28 |
| BIRCHFIELD DR | 28 |
| CATAWBA DR | 28 |
| ASPIN DR | 26 |
| DULANEY DR | 24 |
| HAMPTON DR | 24 |
| Other | 164 |
2002 - 2018 National Fire Incident Reporting System (NFIRS) incidents
- Incident types reported to NFIRS in Harvey, LA
- 2,14624.1%Fire
- 1,99122.3%Hazardous Condition
- 1,75919.7%False Alarm
- 1,40315.7%Rescue & EMS
- 1,26314.2%Good Intent Call
- 3133.5%Service Call
- 120.1%Overpressure Rupture
- 110.1%Severe Weather
- 110.1%Special Incident
- Fire incident types reported to NFIRS in Harvey, LA
- 1,13152.7%Structure Fires
- 54725.5%Outside Fires
- 45321.1%Mobile Property/Vehicle Fires
- 150.7%Other
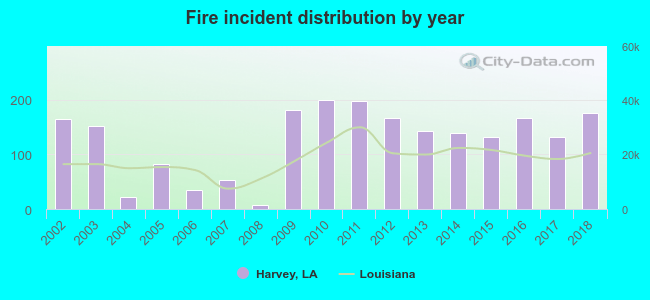 Based on the data from the years 2002 - 2018 the average number of fires per year is 126. The highest number of reported fire incidents - 199 took place in 2010, and the least - 7 in 2008. The data has a rising trend.
The average number of yearly fire incidents per 10k residents in Harvey, LA compared to nearest cities:
(Note: Based on data for the last 3 years, including only cities with population 5,000 and above)
| Harvey: | 77.3 |
| Gretna: | 38.5 |
| Marrero: | 60.6 |
| Terrytown: | 46.7 |
| Westwego: | 38.6 |
| Belle Chasse: | 59.7 |
| New Orleans: | 17.3 |
| Bridge City: | 23.4 |
| Jefferson: | 47.1 |
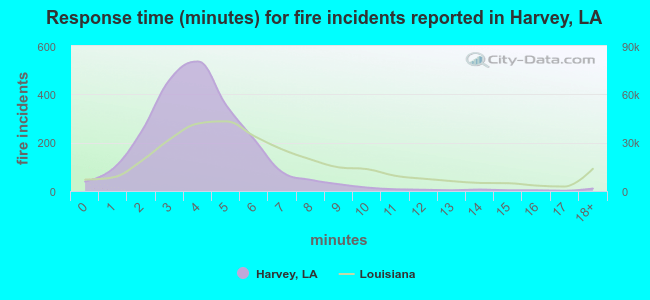 The median response time based on all reported fire incidents is 4 minutes. This is lower than the state median value.
The median response time in Harvey, LA compared to nearest cities:
(Note: Based on data for all years, including only cities with at least 500 fire incidents)
| Harvey: | 4 minutes |
| Gretna: | 3 minutes |
| Marrero: | 4 minutes |
| Terrytown: | 4 minutes |
| Westwego: | 2 minutes |
| Belle Chasse: | 4 minutes |
| New Orleans: | 5 minutes |
| Jefferson: | 4 minutes |
| Chalmette: | 4 minutes |
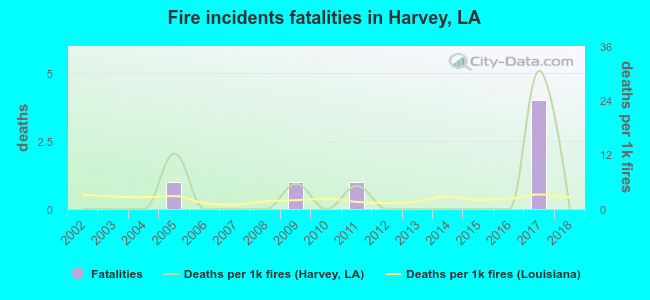 Based on the reports from the years 2002 - 2018 the average number of fire-related fatalities per year is 0. The highest number of reported deaths - 4 took place in 2017, and the lowest - 0 in 2002. The data has a constant trend.
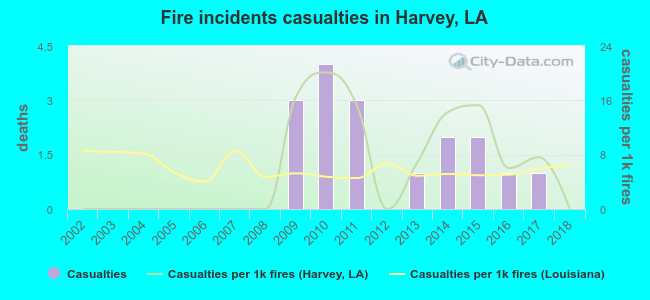 According to the reports from the years 2002 - 2018 the average number of fire-related casualties per year is 1. The highest number of casualties - 4 took place in 2010, and the lowest - 0 in 2002. The data has a constant trend.
The average number of injuries per 1,000 fires is 6. This indicator was the highest - 20 in 2010, and the lowest 0 in 2002. The trend for injuries per 1,000 fires is rising. Compared to the Louisiana value the number of injuries per 1,000 fire incidents is higher.
According to the reports from the years 2002 - 2018 the average number of fire-related casualties per year is 1. The highest number of casualties - 4 took place in 2010, and the lowest - 0 in 2002. The data has a constant trend.
The average number of injuries per 1,000 fires is 6. This indicator was the highest - 20 in 2010, and the lowest 0 in 2002. The trend for injuries per 1,000 fires is rising. Compared to the Louisiana value the number of injuries per 1,000 fire incidents is higher.Casualties per 1,000 incidents in Harvey, LA compared to nearest cities:
(Note: Based on data for all years, including only cities with at least 500 fire incidents)
| Harvey: | 7.9 |
| Gretna: | 4.7 |
| Marrero: | 3.4 |
| Terrytown: | 11.6 |
| Westwego: | 7.5 |
| Belle Chasse: | 8.3 |
| New Orleans: | 3.7 |
| Jefferson: | 6.6 |
| Chalmette: | 12.5 |
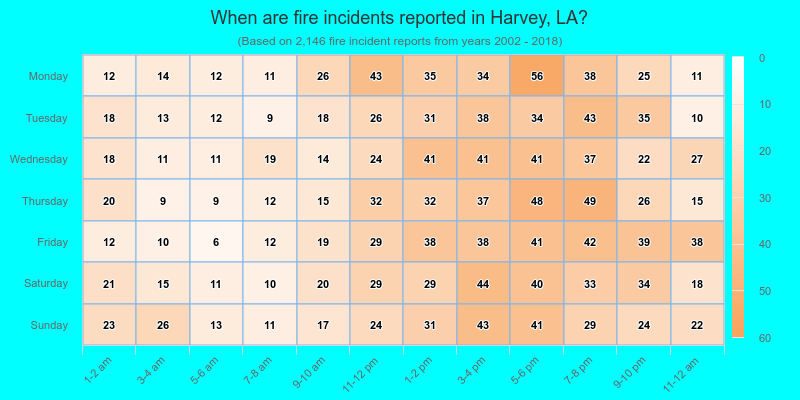
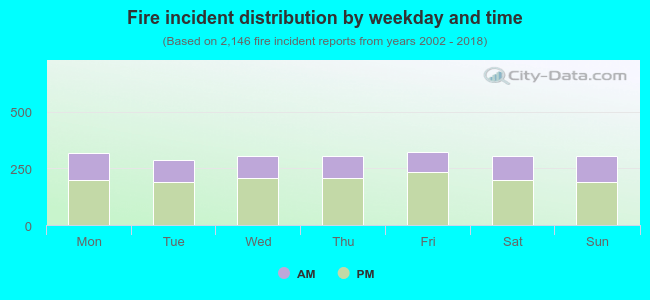 33.4% incidents where reported in the morning and 66.6% in the evening. The most fires (15.1%) took place on Friday, and the least (13.4%) on Tuesday.
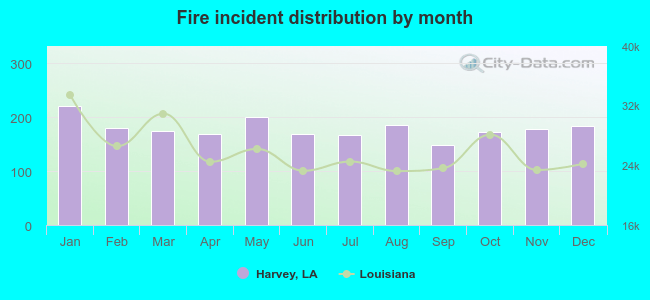 Based on the 2,146 fires from years 2002 - 2018 most fires (10.3%) took place during January, and the least (6.9%) in September.
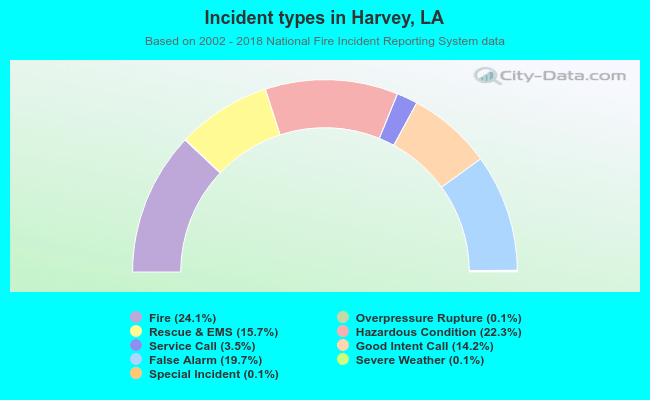 Out of all 8,909 cases reported during the years 2002 - 2018, the most belonged to the categories: Fire (24.1%), Hazardous Condition (22.3%), and False Alarm (19.7%).
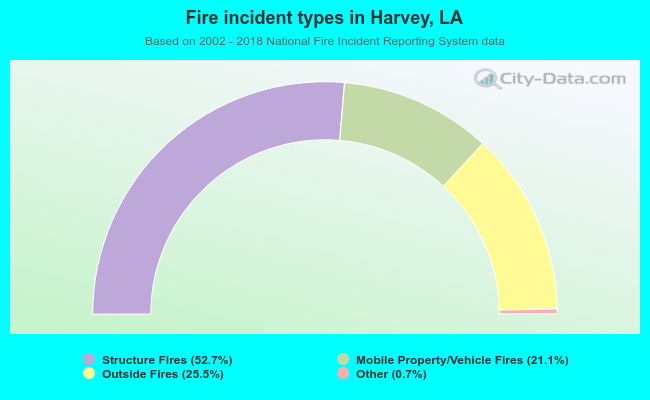 When looking into fire subcategories, the most incidents belonged to: Structure Fires (52.7%), and Outside Fires (25.5%).