Marrero: Fire Incidents, Louisiana (LA)
Where are fire incidents reported in Marrero, LA
Something went wrong! Please refresh the page.
| Fire incidents reported | |
|---|---|
| Sreet name | Count |
| 10TH ST | 1,046 |
| BARATARIA BLVD | 508 |
| AMES BLVD | 310 |
| WESTBANK EXPY | 262 |
| LAPALCO BLVD | 260 |
| 4TH ST | 164 |
| MT.KENNEDY | 74 |
| A AVE | 66 |
| RIVER RD | 64 |
| MEDICAL CENTER BLVD | 52 |
| WESTWOOD DR | 52 |
| B AVE | 48 |
| ROBINSON AVE | 48 |
| CARDINAL DR | 40 |
| D AVE | 40 |
| DOLORES | 40 |
| LINCOLN AVE | 40 |
| OAK DR | 38 |
| FARRINGTON DR | 36 |
| OAK | 36 |
| PRITCHARD RD | 36 |
| TUSA DR | 36 |
| ALLO AVE | 34 |
| SAUVAGE AVE | 34 |
| BECKER | 30 |
| RUE LOUIS PHILLIPE ST | 30 |
| AUGUST AVE | 28 |
| EHRET RD | 28 |
| EIGHTY ARPENT RD | 28 |
| G AVE | 28 |
| Other | 11 |
2002 - 2018 National Fire Incident Reporting System (NFIRS) incidents
- Incident types reported to NFIRS in Marrero, LA
- 3,54726.7%Fire
- 2,97222.3%False Alarm
- 2,48318.7%Good Intent Call
- 2,04515.4%Hazardous Condition
- 1,67212.6%Rescue & EMS
- 5534.2%Service Call
- 210.2%Special Incident
- Fire incident types reported to NFIRS in Marrero, LA
- 2,09859.1%Structure Fires
- 86124.3%Outside Fires
- 55215.6%Mobile Property/Vehicle Fires
- 361.0%Other
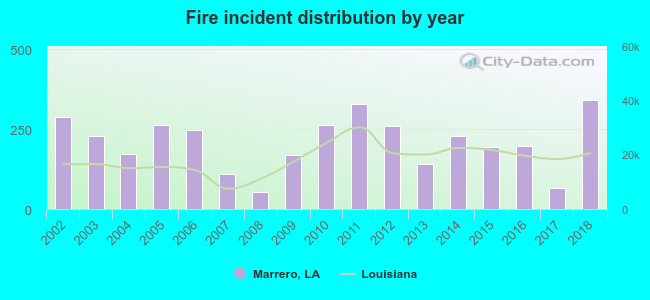 According to the data from the years 2002 - 2018 the average number of fires per year is 209. The highest number of fires - 340 took place in 2018, and the least - 52 in 2008. The data has a growing trend.
The average number of yearly fire incidents per 10k residents in Marrero, LA compared to nearest cities:
(Note: Based on data for the last 3 years, including only cities with population 5,000 and above)
| Marrero: | 60.6 |
| Westwego: | 38.6 |
| Harvey: | 77.3 |
| Gretna: | 38.5 |
| Bridge City: | 23.4 |
| Terrytown: | 46.7 |
| Jefferson: | 47.1 |
| Harahan: | 3.9 |
| New Orleans: | 17.3 |
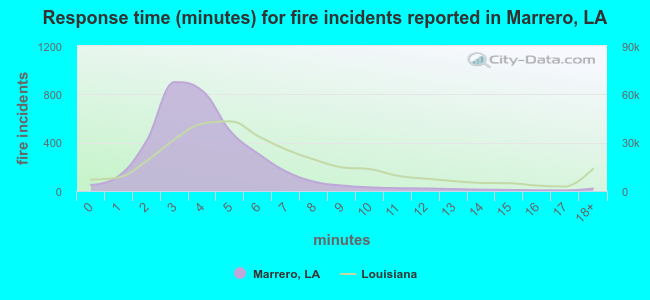 The median response time based on all reported fire incidents is 4 minutes. This is lower than the Louisiana median value.
The median response time in Marrero, LA compared to nearest cities:
(Note: Based on data for all years, including only cities with at least 500 fire incidents)
| Marrero: | 4 minutes |
| Westwego: | 2 minutes |
| Harvey: | 4 minutes |
| Gretna: | 3 minutes |
| Terrytown: | 4 minutes |
| Avondale: | 3 minutes |
| Jefferson: | 4 minutes |
| New Orleans: | 5 minutes |
| Belle Chasse: | 4 minutes |
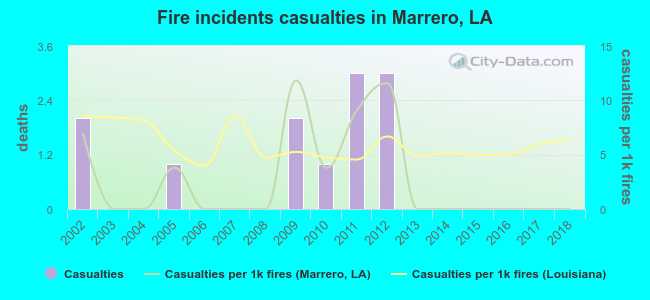 According to the data from the years 2002 - 2018 the average number of fire-related casualties per year is 1. The highest number of casualties - 3 took place in 2011, and the lowest - 0 in 2003. The data has a decreasing trend.
The average number of casualties per 1,000 fire incidents is 3. This indicator was the highest - 12 in 2009, and the lowest 0 in 2003. The trend for injuries per 1,000 incidents is declining. Compared to the Louisiana value the number of casualties per 1,000 incidents is lower.
According to the data from the years 2002 - 2018 the average number of fire-related casualties per year is 1. The highest number of casualties - 3 took place in 2011, and the lowest - 0 in 2003. The data has a decreasing trend.
The average number of casualties per 1,000 fire incidents is 3. This indicator was the highest - 12 in 2009, and the lowest 0 in 2003. The trend for injuries per 1,000 incidents is declining. Compared to the Louisiana value the number of casualties per 1,000 incidents is lower.Casualties per 1,000 incidents in Marrero, LA compared to nearest cities:
(Note: Based on data for all years, including only cities with at least 500 fire incidents)
| Marrero: | 3.4 |
| Westwego: | 7.5 |
| Harvey: | 7.9 |
| Gretna: | 4.7 |
| Terrytown: | 11.6 |
| Avondale: | 0.0 |
| Jefferson: | 6.6 |
| New Orleans: | 3.7 |
| Belle Chasse: | 8.3 |
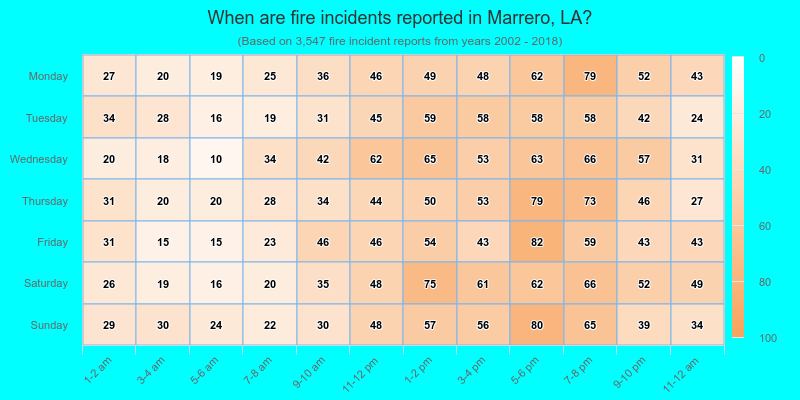
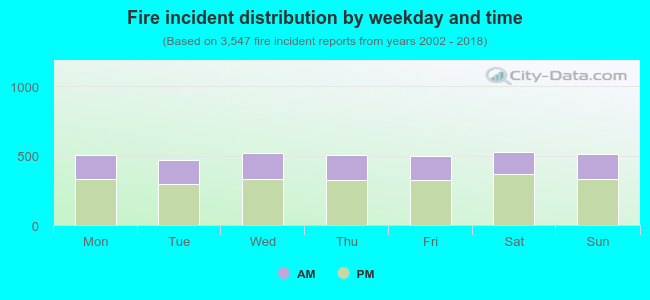 34.7% incidents where reported in the morning and 65.3% in the evening. The most fires (14.9%) took place on Saturday, and the least (13.3%) on Tuesday.
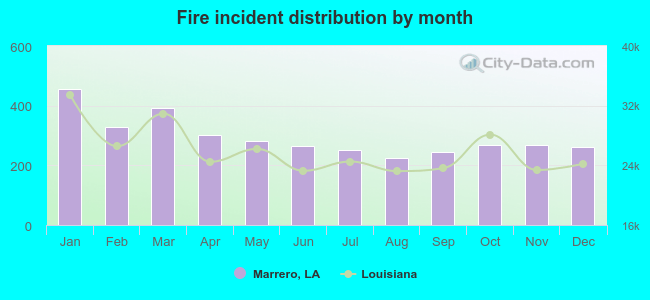 According to the 3,547 fires from years 2002 - 2018 most fires (12.9%) took place during January, and the least (6.3%) in August.
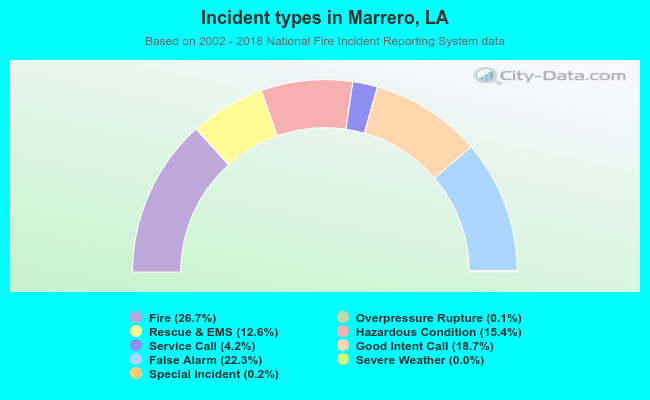 Out of all 13,307 cases reported during the years 2002 - 2018, the most belonged to the categories: Fire (26.7%), False Alarm (22.3%), and Good Intent Call (18.7%).
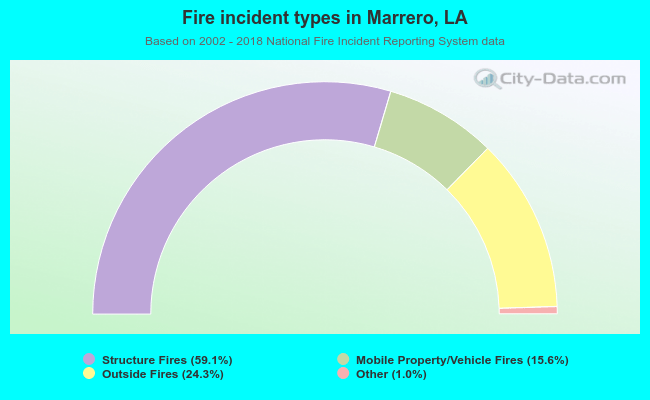 When looking into fire subcategories, the most reports belonged to: Structure Fires (59.1%), and Outside Fires (24.3%).