Groves: Fire Incidents, Texas (TX)
Where are fire incidents reported in Groves, TX
Something went wrong! Please refresh the page.
| Fire incidents reported | |
|---|---|
| Sreet name | Count |
| HWY 87 | 100 |
| 32 ND ST | 90 |
| TERRELL ST | 86 |
| HOWE ST | 82 |
| MAIN AVE | 76 |
| MONROE ST | 62 |
| HWY 347 | 58 |
| 39 TH ST | 56 |
| HWY 366 | 48 |
| TAFT AVE | 48 |
| 25 TH ST | 44 |
| BOYD AVE | 40 |
| CANAL AVE | 40 |
| WARREN ST | 38 |
| EAST PARKWAY | 34 |
| WILSON AVE | 34 |
| JEFFERSON ST | 32 |
| WEST JEFFERSON ST | 30 |
| HOGABOOM ST | 28 |
| BELLAIRE AVE | 26 |
| BERRY AVE | 26 |
| GULF AVE | 26 |
| GULFWAY DR | 26 |
| HWY 73 HWY | 26 |
| CHARLES AVE | 24 |
| CLEVELAND AVE | 24 |
| MONROE | 24 |
| HIGH AVE | 22 |
| WASHINGTON ST | 22 |
| GRAVES AVE | 20 |
| Other | 244 |
2004 - 2018 National Fire Incident Reporting System (NFIRS) incidents
- Incident types reported to NFIRS in Groves, TX
- 6,05960.2%Rescue & EMS
- 1,53615.3%Fire
- 1,27512.7%Hazardous Condition
- 4954.9%Good Intent Call
- 3813.8%False Alarm
- 2922.9%Service Call
- 140.1%Special Incident
- Fire incident types reported to NFIRS in Groves, TX
- 72547.2%Structure Fires
- 57637.5%Outside Fires
- 1378.9%Other
- 986.4%Mobile Property/Vehicle Fires
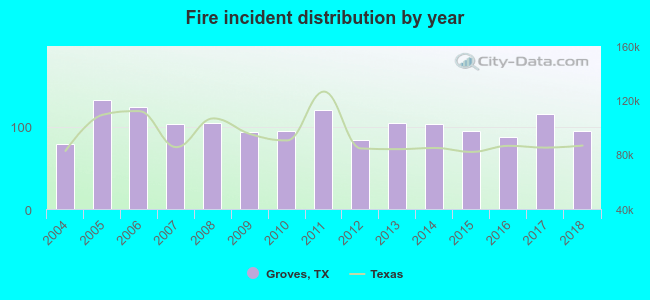 According to the data from the years 2004 - 2018 the average number of fire incidents per year is 102. The highest number of fire incidents - 132 took place in 2005, and the least - 79 in 2004. The data has a rising trend.
The average number of yearly fire incidents per 10k residents in Groves, TX compared to nearest cities:
(Note: Based on data for the last 3 years, including only cities with population 5,000 and above)
| Groves: | 63.1 |
| Port Neches: | 43.6 |
| Port Arthur: | 65.2 |
| Nederland: | 62.2 |
| Bridge City: | 86.7 |
| Vidor: | 261.3 |
| Orange: | 82.5 |
| Beaumont: | 45.4 |
| Lumberton: | 3.5 |
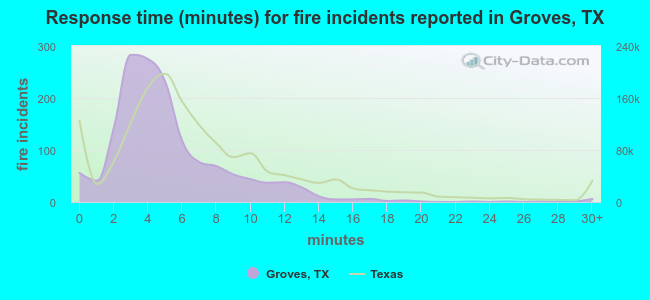 The median response time based on all reported fire incidents is 4 minutes. This is lower compared to the Texas median value.
The median response time in Groves, TX compared to nearest cities:
(Note: Based on data for all years, including only cities with at least 500 fire incidents)
| Groves: | 4 minutes |
| Port Neches: | 5 minutes |
| Port Arthur: | 4 minutes |
| Nederland: | 5 minutes |
| Bridge City: | 8 minutes |
| Vidor: | 7 minutes |
| Orange: | 5 minutes |
| Beaumont: | 4 minutes |
| Vinton: | 7 minutes |
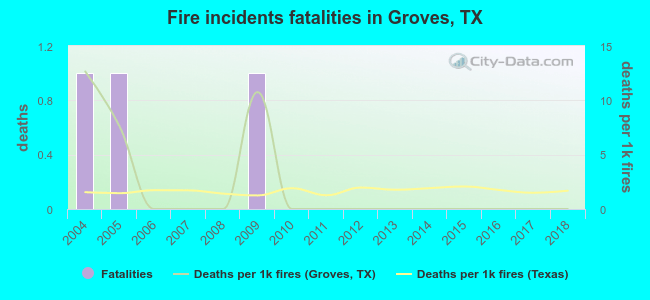 Based on the reports from the years 2004 - 2018 the average number of fire-related fatalities per year is 0. The highest number of deaths - 1 took place in 2004, and the lowest - 0 in 2006. The data has a dropping trend.
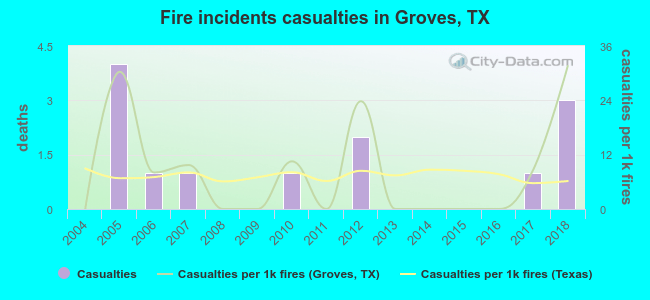 Based on the reports from the years 2004 - 2018 the average number of fire-related yearly casualties is 1. The highest number of reported casualties - 4 took place in 2005, and the lowest - 0 in 2004. The data has an increasing trend.
The average number of injuries per 1,000 fire incidents is 8. This indicator was the highest - 32 in 2018, and the lowest 0 in 2004. The trend for injuries per 1,000 incidents is increasing. Compared to the Texas value the number of injuries per 1,000 fire incidents is about the same.
Based on the reports from the years 2004 - 2018 the average number of fire-related yearly casualties is 1. The highest number of reported casualties - 4 took place in 2005, and the lowest - 0 in 2004. The data has an increasing trend.
The average number of injuries per 1,000 fire incidents is 8. This indicator was the highest - 32 in 2018, and the lowest 0 in 2004. The trend for injuries per 1,000 incidents is increasing. Compared to the Texas value the number of injuries per 1,000 fire incidents is about the same.Casualties per 1,000 incidents in Groves, TX compared to nearest cities:
(Note: Based on data for all years, including only cities with at least 500 fire incidents)
| Groves: | 8.5 |
| Port Neches: | 10.4 |
| Port Arthur: | 5.5 |
| Nederland: | 11.5 |
| Bridge City: | 0.6 |
| Vidor: | 4.2 |
| Orange: | 6.8 |
| Beaumont: | 22.3 |
| Vinton: | 3.9 |
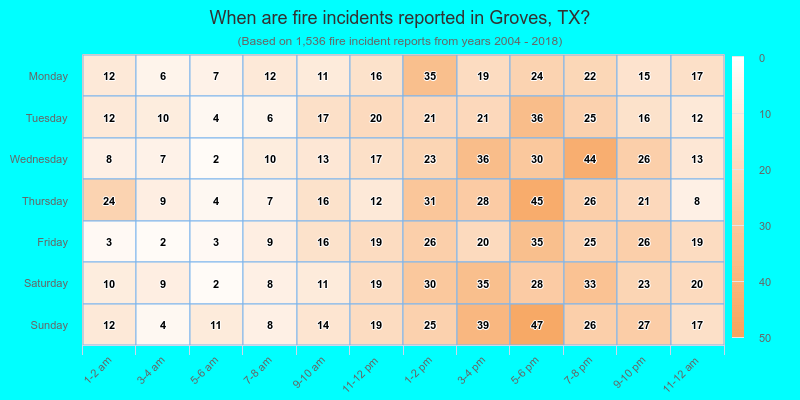
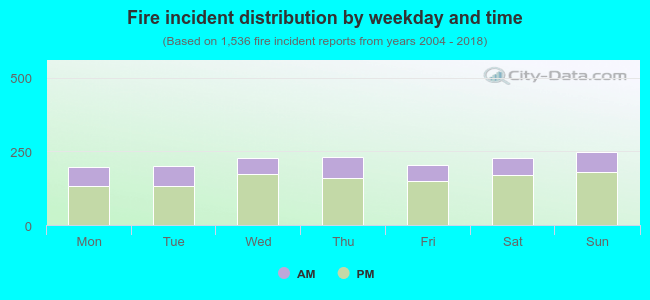 28.7% incidents where reported in the morning and 71.3% in the evening. The most fires (16.2%) took place on Sunday, and the least (12.8%) on Monday.
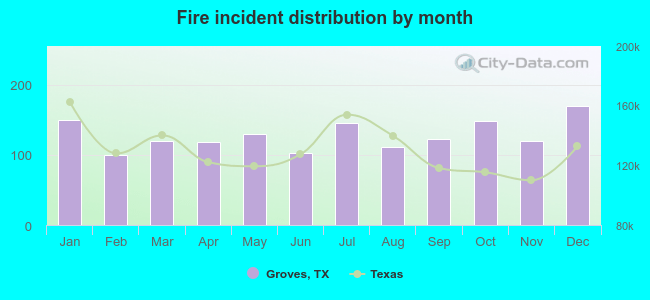 Based on the 1,536 incident reports from years 2004 - 2018 most fires (11.1%) took place during December, and the least (6.5%) in February.
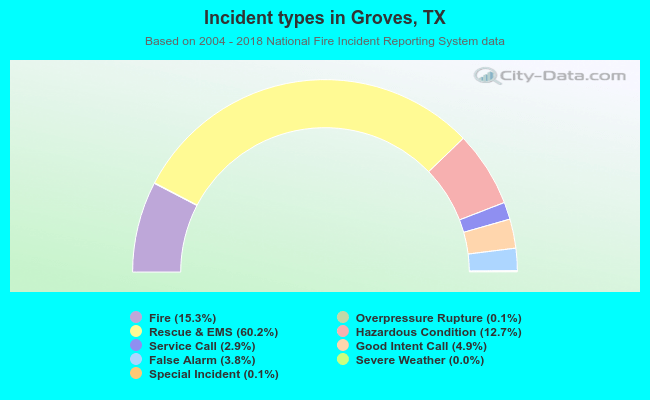 Out of all 10,061 cases reported during the years 2004 - 2018, the most belonged to the categories: Rescue & EMS (60.2%), Fire (15.3%), and Hazardous Condition (12.7%).
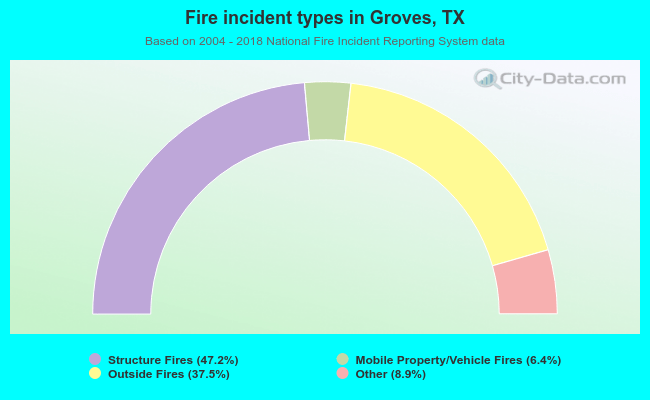 When looking into fire subcategories, the most reports belonged to: Structure Fires (47.2%), and Outside Fires (37.5%).