Port Arthur: Fire Incidents, Texas (TX)
Where are fire incidents reported in Port Arthur, TX
Something went wrong! Please refresh the page.
| Fire incidents reported | |
|---|---|
| Sreet name | Count |
| GULFWAY DR | 924 |
| 73 HWY | 340 |
| MEMORIAL BLVD | 334 |
| 365 HWY | 266 |
| 9 AVE | 238 |
| TWIN CITY HWY | 238 |
| PROCTER ST | 212 |
| 7 ST | 178 |
| JEFFERSON DR | 154 |
| HWY 365 | 150 |
| HWY 73 | 150 |
| 6 ST | 136 |
| 5 ST | 124 |
| 11 ST | 122 |
| 7TH ST | 122 |
| 9TH AV | 120 |
| 10 ST | 118 |
| 9 ST | 118 |
| JIMMY JOHNSON BLVD | 118 |
| 14 ST | 114 |
| 12 ST | 110 |
| LAKESHORE DR | 110 |
| 13 ST | 108 |
| 15 ST | 102 |
| MEMORIAL BL | 102 |
| 6TH ST | 100 |
| 5TH ST | 92 |
| 8 ST | 90 |
| LAKE ARTHUR DR | 86 |
| 60 ST | 84 |
| Other | 2,007 |
2002 - 2018 National Fire Incident Reporting System (NFIRS) incidents
- Incident types reported to NFIRS in Port Arthur, TX
- 46,04266.3%Rescue & EMS
- 7,26710.5%Fire
- 5,6928.2%False Alarm
- 4,9637.1%Hazardous Condition
- 3,0134.3%Good Intent Call
- 1,4292.1%Service Call
- 8511.2%Severe Weather
- 1090.2%Special Incident
- 720.1%Overpressure Rupture
- Fire incident types reported to NFIRS in Port Arthur, TX
- 3,00941.4%Outside Fires
- 2,69037.0%Structure Fires
- 1,20916.6%Mobile Property/Vehicle Fires
- 3594.9%Other
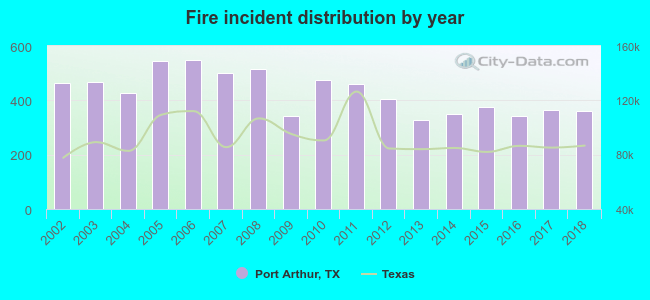 Based on the data from the years 2002 - 2018 the average number of fire incidents per year is 427. The highest number of fires - 547 took place in 2006, and the least - 327 in 2013. The data has a declining trend.
The average number of yearly fire incidents per 10k residents in Port Arthur, TX compared to nearest cities:
(Note: Based on data for the last 3 years, including only cities with population 5,000 and above)
| Port Arthur: | 65.2 |
| Groves: | 63.1 |
| Port Neches: | 43.6 |
| Nederland: | 62.2 |
| Bridge City: | 86.7 |
| Vidor: | 261.3 |
| Beaumont: | 45.4 |
| Orange: | 82.5 |
| Lumberton: | 3.5 |
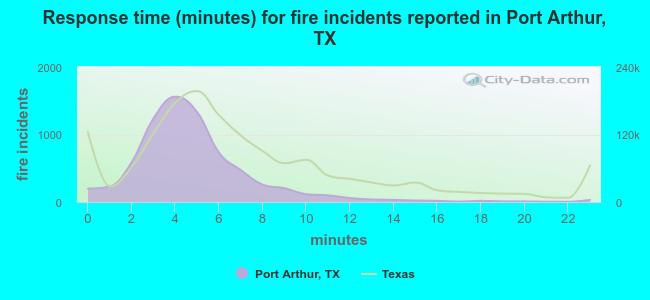 The median response time based on all reported fire incidents is 4 minutes. This is lower compared to the state median value.
The median response time in Port Arthur, TX compared to nearest cities:
(Note: Based on data for all years, including only cities with at least 500 fire incidents)
| Port Arthur: | 4 minutes |
| Groves: | 4 minutes |
| Port Neches: | 5 minutes |
| Nederland: | 5 minutes |
| Bridge City: | 8 minutes |
| Vidor: | 7 minutes |
| Beaumont: | 4 minutes |
| Orange: | 5 minutes |
| Vinton: | 7 minutes |
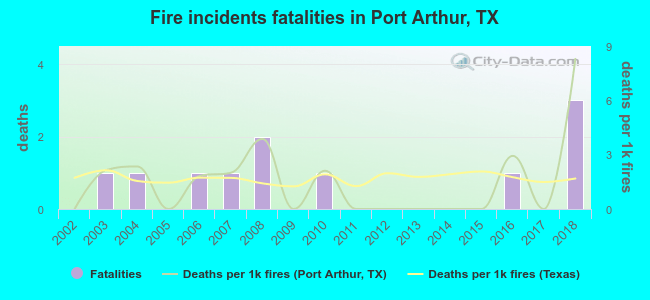 Based on the reports from the years 2002 - 2018 the average number of fire-related fatalities per year is 1. The highest number of deaths - 3 took place in 2018, and the lowest - 0 in 2002. The data has a growing trend.
The average number of fatalities per 1,000 fire incidents is 2. This indicator was the highest - 8 in 2018, and the lowest 0 in 2002. The trend for fatalities per 1,000 fires is increasing. Compared to the Texas value the number of fatalities per 1,000 fires is similar.
Based on the reports from the years 2002 - 2018 the average number of fire-related fatalities per year is 1. The highest number of deaths - 3 took place in 2018, and the lowest - 0 in 2002. The data has a growing trend.
The average number of fatalities per 1,000 fire incidents is 2. This indicator was the highest - 8 in 2018, and the lowest 0 in 2002. The trend for fatalities per 1,000 fires is increasing. Compared to the Texas value the number of fatalities per 1,000 fires is similar.
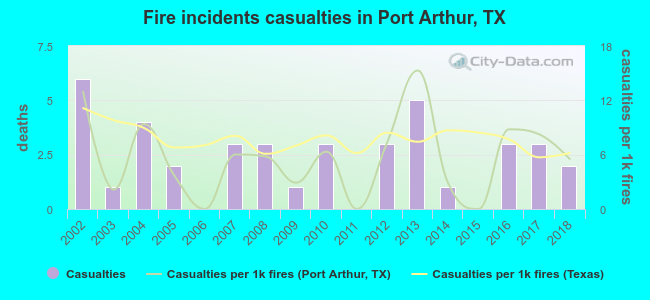 According to the data from the years 2002 - 2018 the average number of fire-related casualties per year is 2. The highest number of reported casualties - 6 took place in 2002, and the lowest - 0 in 2006. The data has a decreasing trend.
The average number of casualties per 1,000 fires is 6. This indicator was the highest - 15 in 2013, and the lowest 0 in 2006. The trend for casualties per 1,000 incidents is declining. Compared to the state value the number of injuries per 1,000 fires is lower.
According to the data from the years 2002 - 2018 the average number of fire-related casualties per year is 2. The highest number of reported casualties - 6 took place in 2002, and the lowest - 0 in 2006. The data has a decreasing trend.
The average number of casualties per 1,000 fires is 6. This indicator was the highest - 15 in 2013, and the lowest 0 in 2006. The trend for casualties per 1,000 incidents is declining. Compared to the state value the number of injuries per 1,000 fires is lower.Casualties per 1,000 incidents in Port Arthur, TX compared to nearest cities:
(Note: Based on data for all years, including only cities with at least 500 fire incidents)
| Port Arthur: | 5.5 |
| Groves: | 8.5 |
| Port Neches: | 10.4 |
| Nederland: | 11.5 |
| Bridge City: | 0.6 |
| Vidor: | 4.2 |
| Beaumont: | 22.3 |
| Orange: | 6.8 |
| Vinton: | 3.9 |
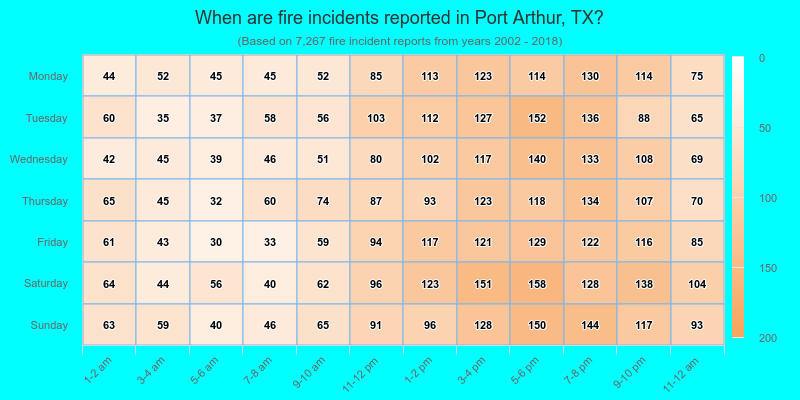
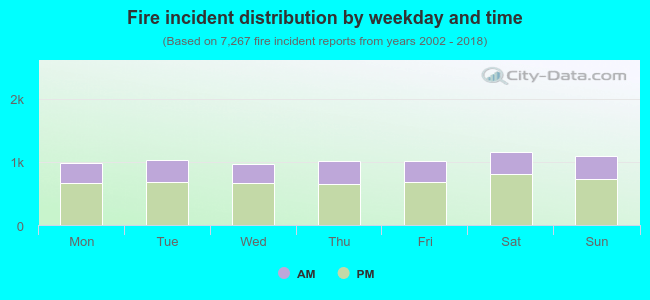 32.8% incidents where reported in the morning and 67.2% in the evening. The most fires (16.0%) took place on Saturday, and the least (13.4%) on Wednesday.
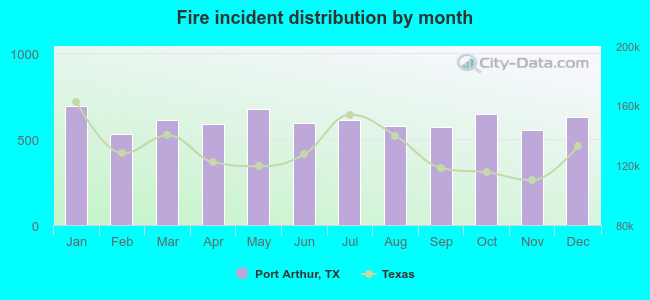 According to the 7,267 incident reports from years 2002 - 2018 most fires (9.6%) took place during January, and the least (7.3%) in February.
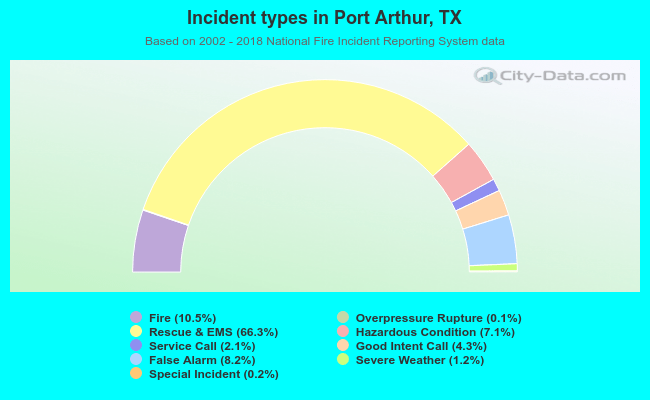 Out of all 69,438 cases reported during the years 2002 - 2018, the most belonged to the categories: Rescue & EMS (66.3%), Fire (10.5%), and False Alarm (8.2%).
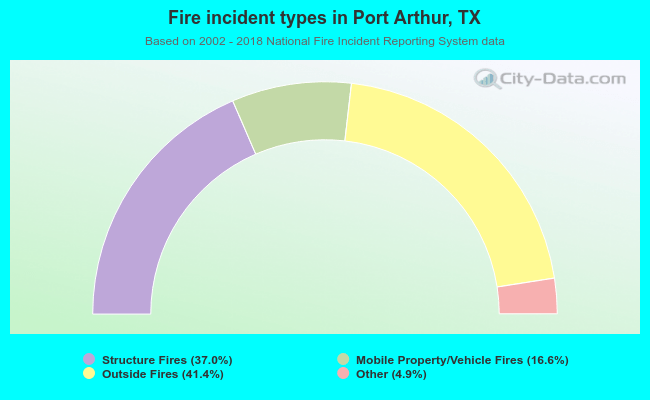 When looking into fire subcategories, the most reports belonged to: Outside Fires (41.4%), and Structure Fires (37.0%).