Nederland: Fire Incidents, Texas (TX)
Where are fire incidents reported in Nederland, TX
Something went wrong! Please refresh the page.
| Fire incidents reported | |
|---|---|
| Sreet name | Count |
| NEDERLAND AVE | 132 |
| TWIN CITY HWY | 92 |
| 69 HWY | 82 |
| 365 HWY | 72 |
| HWY 347 HWY | 64 |
| AVENUE H | 60 |
| ATLANTA | 58 |
| HWY 365 | 54 |
| AVENUE B | 48 |
| HWY 69 HWY | 44 |
| 27TH ST | 36 |
| AVENUE A | 32 |
| GARDEN DR | 32 |
| HWY 69 | 30 |
| AVENUE G | 26 |
| HELENA | 26 |
| BOSTON AVE | 24 |
| 17TH ST | 22 |
| AVE H | 22 |
| AVENUE E | 22 |
| AVENUE M | 22 |
| BOSTON | 22 |
| CHICAGO AVE | 22 |
| H AVE | 22 |
| SPURLOCK RD | 22 |
| 12TH ST | 20 |
| 13TH | 20 |
| 13TH ST | 20 |
| 22ND ST | 20 |
| AVE E | 20 |
| Other | 372 |
2002 - 2018 National Fire Incident Reporting System (NFIRS) incidents
- Incident types reported to NFIRS in Nederland, TX
- 6,13949.6%Rescue & EMS
- 2,00816.2%Hazardous Condition
- 1,56012.6%Fire
- 1,1969.7%Good Intent Call
- 9407.6%Service Call
- 4984.0%False Alarm
- 140.1%Overpressure Rupture
- 130.1%Special Incident
- Fire incident types reported to NFIRS in Nederland, TX
- 76449.0%Structure Fires
- 52033.3%Outside Fires
- 16910.8%Mobile Property/Vehicle Fires
- 1076.9%Other
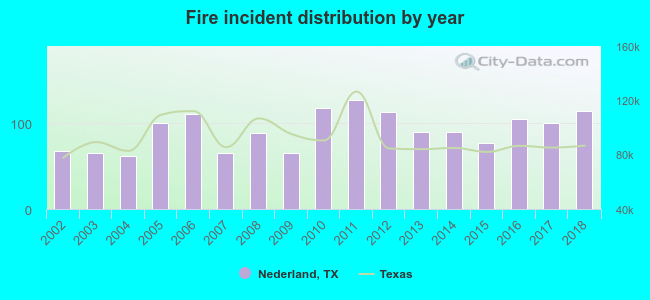 Based on the data from the years 2002 - 2018 the average number of fire incidents per year is 92. The highest number of reported fire incidents - 127 took place in 2011, and the least - 62 in 2004. The data has a rising trend.
The average number of yearly fire incidents per 10k residents in Nederland, TX compared to nearest cities:
(Note: Based on data for the last 3 years, including only cities with population 5,000 and above)
| Nederland: | 62.2 |
| Port Neches: | 43.6 |
| Groves: | 63.1 |
| Port Arthur: | 65.2 |
| Bridge City: | 86.7 |
| Beaumont: | 45.4 |
| Vidor: | 261.3 |
| Orange: | 82.5 |
| Lumberton: | 3.5 |
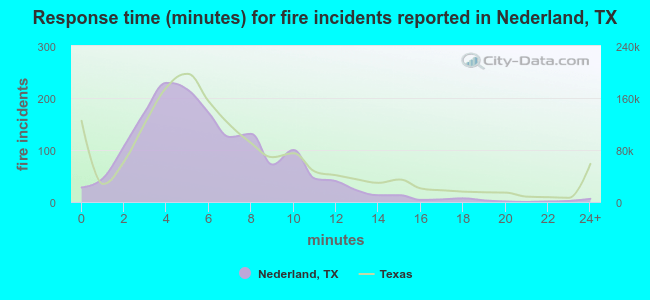 The median response time based on all reported fire incidents is 5 minutes. This is lower than the Texas median value.
The median response time in Nederland, TX compared to nearest cities:
(Note: Based on data for all years, including only cities with at least 500 fire incidents)
| Nederland: | 5 minutes |
| Port Neches: | 5 minutes |
| Groves: | 4 minutes |
| Port Arthur: | 4 minutes |
| Bridge City: | 8 minutes |
| Beaumont: | 4 minutes |
| Vidor: | 7 minutes |
| Orange: | 5 minutes |
| Lumberton: | 8 minutes |
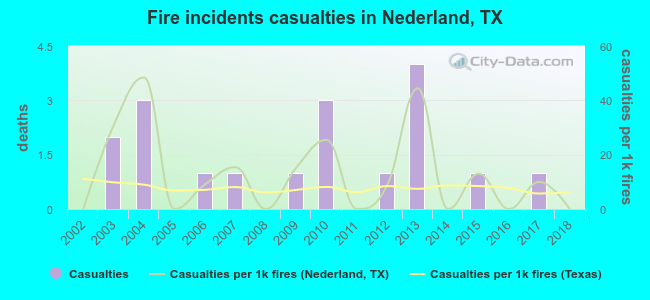 Based on the data from the years 2002 - 2018 the average number of fire-related casualties per year is 1. The highest number of reported injuries - 4 took place in 2013, and the lowest - 0 in 2002. The data has a constant trend.
The average number of injuries per 1,000 fires is 13. This indicator was the highest - 48 in 2004, and the lowest 0 in 2002. The trend for injuries per 1,000 fires is decreasing. Compared to the Texas value the number of injuries per 1,000 fire incidents is higher.
Based on the data from the years 2002 - 2018 the average number of fire-related casualties per year is 1. The highest number of reported injuries - 4 took place in 2013, and the lowest - 0 in 2002. The data has a constant trend.
The average number of injuries per 1,000 fires is 13. This indicator was the highest - 48 in 2004, and the lowest 0 in 2002. The trend for injuries per 1,000 fires is decreasing. Compared to the Texas value the number of injuries per 1,000 fire incidents is higher.Casualties per 1,000 incidents in Nederland, TX compared to nearest cities:
(Note: Based on data for all years, including only cities with at least 500 fire incidents)
| Nederland: | 11.5 |
| Port Neches: | 10.4 |
| Groves: | 8.5 |
| Port Arthur: | 5.5 |
| Bridge City: | 0.6 |
| Beaumont: | 22.3 |
| Vidor: | 4.2 |
| Orange: | 6.8 |
| Lumberton: | 1.5 |
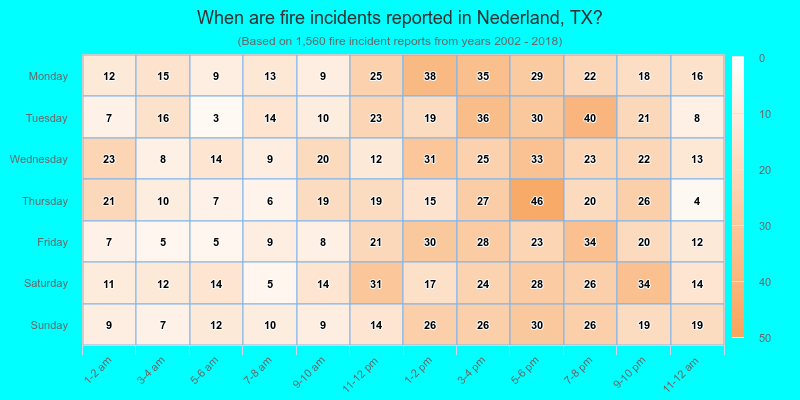
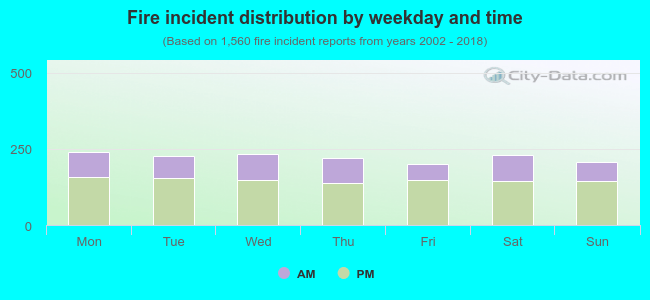 33.8% incidents where reported in the morning and 66.2% in the evening. The most fires (15.4%) took place on Monday, and the least (12.9%) on Friday.
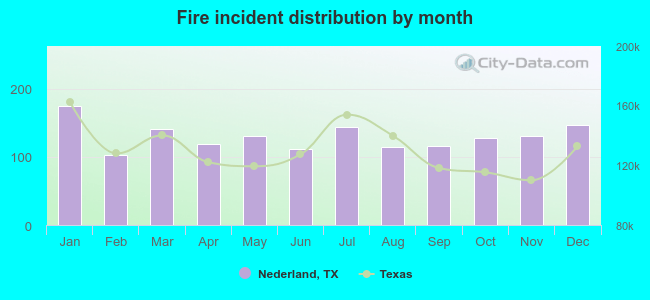 According to the 1,560 fires from years 2002 - 2018 most fires (11.2%) took place during January, and the least (6.6%) in February.
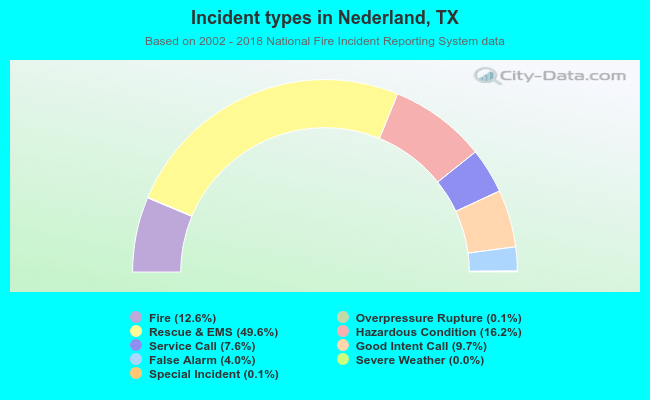 Out of all 12,372 cases reported during the years 2002 - 2018, the most belonged to the categories: Rescue & EMS (49.6%), Hazardous Condition (16.2%), and Fire (12.6%).
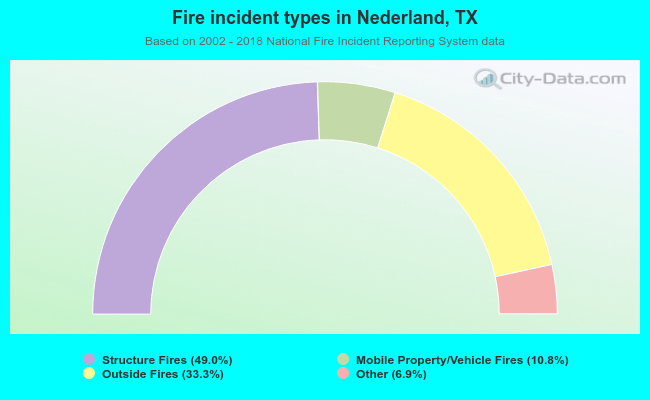 When looking into fire subcategories, the most incidents belonged to: Structure Fires (49.0%), and Outside Fires (33.3%).