Halstead: Fire Incidents, Kansas (KS)
Where are fire incidents reported in Halstead, KS
Something went wrong! Please refresh the page.
|
| |||||||||||||||||||||||||||||||||||||||||||||||||||||||||||||||||||||||||||||||||||||||||||||||||||||||||||||
2002 - 2018 National Fire Incident Reporting System (NFIRS) incidents
- Incident types reported to NFIRS in Halstead, KS
- 78348.1%Rescue & EMS
- 50330.9%Fire
- 1147.0%Hazardous Condition
- 1006.1%Good Intent Call
- 633.9%False Alarm
- 482.9%Service Call
- 70.4%Special Incident
- 60.4%Overpressure Rupture
- 50.3%Severe Weather
- Fire incident types reported to NFIRS in Halstead, KS
- 30861.2%Outside Fires
- 12925.6%Structure Fires
- 367.2%Mobile Property/Vehicle Fires
- 306.0%Other
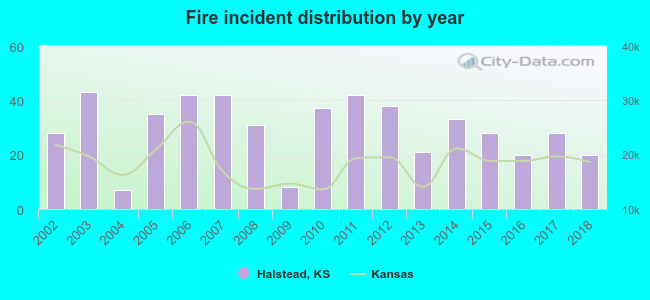 Based on the data from the years 2002 - 2018 the average number of fires per year is 30. The highest number of fires - 43 took place in 2003, and the least - 7 in 2004. The data has a dropping trend.
 The median response time based on all reported fire incidents is 6 minutes. This is close to the Kansas median value.
The median response time in Halstead, KS compared to nearest cities:
(Note: Based on data for all years, including only cities with at least 500 fire incidents)
| Halstead: | 6 minutes |
| Newton: | 7 minutes |
| Valley Center: | 8 minutes |
| Inman: | 10 minutes |
| Hutchinson: | 6 minutes |
| Wichita: | 4 minutes |
| Goddard: | 7 minutes |
| Benton: | 10 minutes |
| McPherson: | 5 minutes |
 Based on the data from the years 2002 - 2018 the average number of fire-related fatalities per year is 0. The highest number of deaths - 1 took place in 2011, and the lowest - 0 in 2002. The data has a rising trend.
 21.9% incidents where reported in the morning and 78.1% in the evening. The most fires (19.7%) took place on Friday, and the least (11.7%) on Thursday.
 According to the 503 fires from years 2002 - 2018 most fires (15.9%) took place during March, and the least (4.0%) in October.
 Out of all 1,629 cases reported during the years 2002 - 2018, the most belonged to the categories: Rescue & EMS (48.1%), Fire (30.9%), and Hazardous Condition (7.0%).
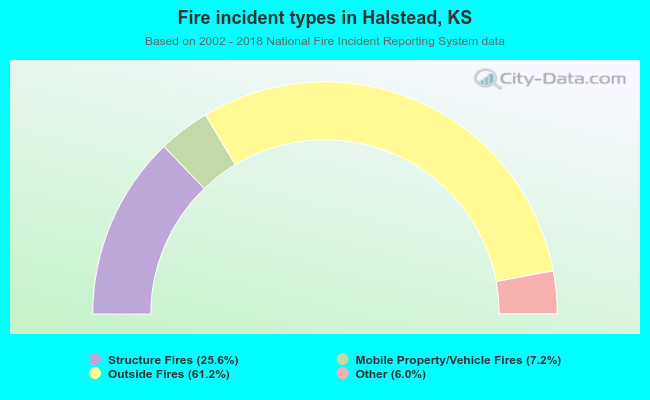 When looking into fire subcategories, the most reports belonged to: Outside Fires (61.2%), and Structure Fires (25.6%).