Newton: Fire Incidents, Kansas (KS)
Where are fire incidents reported in Newton, KS
Something went wrong! Please refresh the page.
| Fire incidents reported | |
|---|---|
| Sreet name | Count |
| 24TH ST | 110 |
| 1ST ST | 104 |
| 12TH ST | 100 |
| KANSAS AVE | 96 |
| I135 HWY | 74 |
| 5TH ST | 70 |
| BROADWAY ST | 58 |
| MAIN ST | 58 |
| 36TH ST | 56 |
| 12TH | 48 |
| 9TH ST | 46 |
| KANSAS | 42 |
| RIDGE RD | 42 |
| SPENCER ST | 40 |
| 24TH | 38 |
| 36TH | 38 |
| 4TH ST | 38 |
| 6TH ST | 38 |
| MERIDIAN RD | 38 |
| MERIDIAN ST | 38 |
| 3RD ST | 36 |
| I135 | 36 |
| HOOVER RD | 34 |
| 11TH ST | 32 |
| 10TH ST | 30 |
| 8TH ST | 30 |
| SPENCER | 30 |
| 48TH ST | 28 |
| HILLSIDE RD | 26 |
| MERIDIAN | 26 |
| Other | 119 |
2002 - 2018 National Fire Incident Reporting System (NFIRS) incidents
- Incident types reported to NFIRS in Newton, KS
- 11,04474.3%Rescue & EMS
- 1,59910.8%Fire
- 8435.7%Hazardous Condition
- 5663.8%Good Intent Call
- 5263.5%Service Call
- 2671.8%False Alarm
- Fire incident types reported to NFIRS in Newton, KS
- 83952.5%Outside Fires
- 47729.8%Structure Fires
- 20412.8%Mobile Property/Vehicle Fires
- 794.9%Other
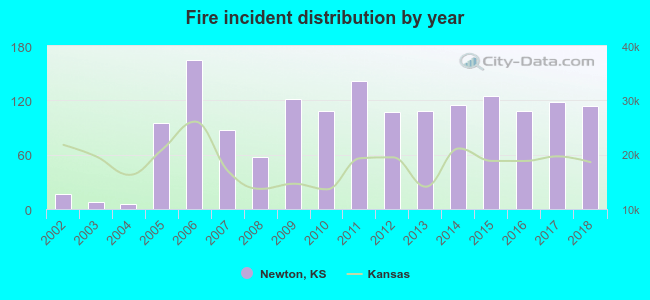 Based on the data from the years 2002 - 2018 the average number of fire incidents per year is 94. The highest number of fires - 164 took place in 2006, and the least - 5 in 2004. The data has an increasing trend.
The average number of yearly fire incidents per 10k residents in Newton, KS compared to nearest cities:
(Note: Based on data for the last 3 years, including only cities with population 5,000 and above)
| Newton: | 59.3 |
| Valley Center: | 119.5 |
| Park City: | 41.9 |
| Bel Aire: | 17.4 |
| Wichita: | 48.0 |
| Andover: | 51.4 |
| McPherson: | 61.2 |
| El Dorado: | 87.7 |
| Hutchinson: | 83.9 |
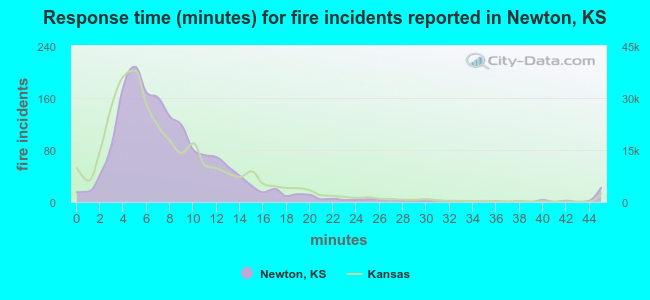 The median response time based on all reported fire incidents is 7 minutes. This is close to the state median value.
The median response time in Newton, KS compared to nearest cities:
(Note: Based on data for all years, including only cities with at least 500 fire incidents)
| Newton: | 7 minutes |
| Halstead: | 6 minutes |
| Valley Center: | 8 minutes |
| Benton: | 10 minutes |
| Wichita: | 4 minutes |
| Inman: | 10 minutes |
| Andover: | 5 minutes |
| McPherson: | 5 minutes |
| Goddard: | 7 minutes |
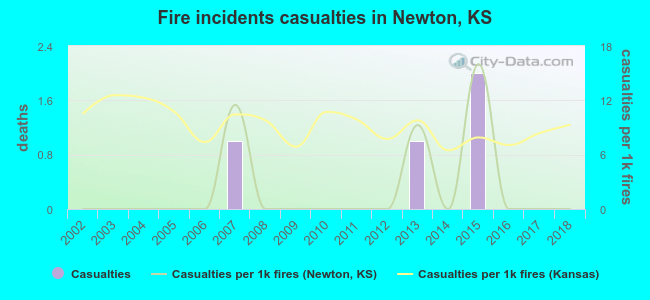 According to the data from the years 2002 - 2018 the average number of fire-related yearly casualties is 0. The highest number of casualties - 2 took place in 2015, and the lowest - 0 in 2002. The data has a constant trend.
The average number of casualties per 1,000 fires is 2. This indicator was the highest - 16 in 2015, and the lowest 0 in 2002. The trend for casualties per 1,000 incidents is constant. Compared to the state value the number of injuries per 1,000 fire incidents is much lower.
According to the data from the years 2002 - 2018 the average number of fire-related yearly casualties is 0. The highest number of casualties - 2 took place in 2015, and the lowest - 0 in 2002. The data has a constant trend.
The average number of casualties per 1,000 fires is 2. This indicator was the highest - 16 in 2015, and the lowest 0 in 2002. The trend for casualties per 1,000 incidents is constant. Compared to the state value the number of injuries per 1,000 fire incidents is much lower.
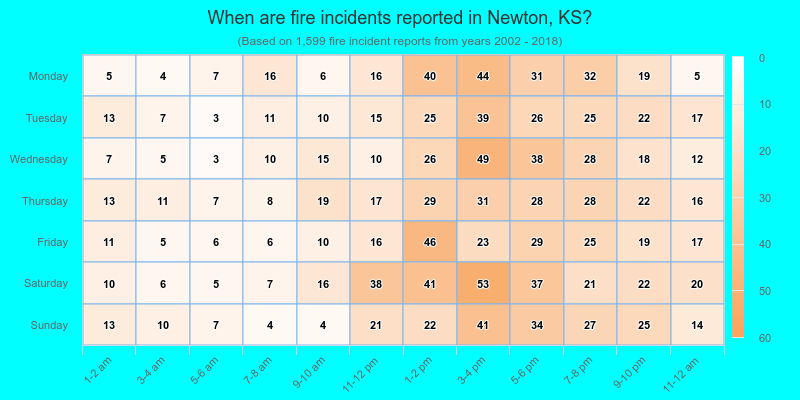
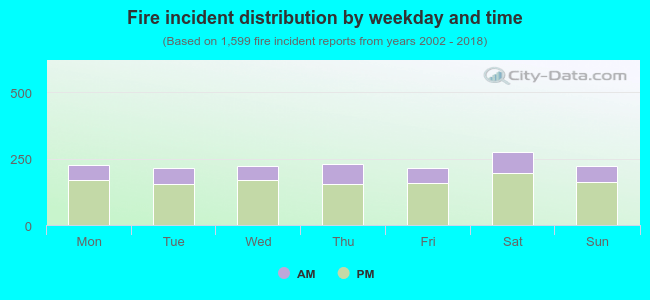 27.1% incidents where reported in the morning and 72.9% in the evening. The most fires (17.3%) took place on Saturday, and the least (13.3%) on Tuesday.
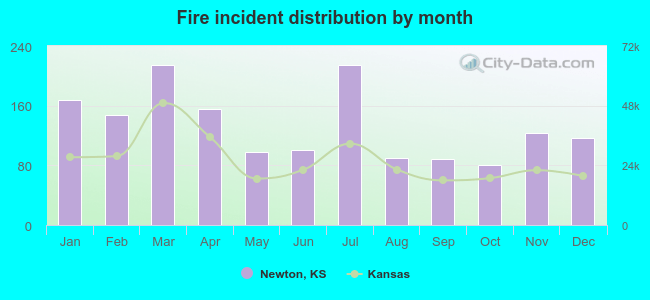 Based on the 1,599 fires from years 2002 - 2018 most fires (13.4%) took place during March, and the least (5.1%) in October.
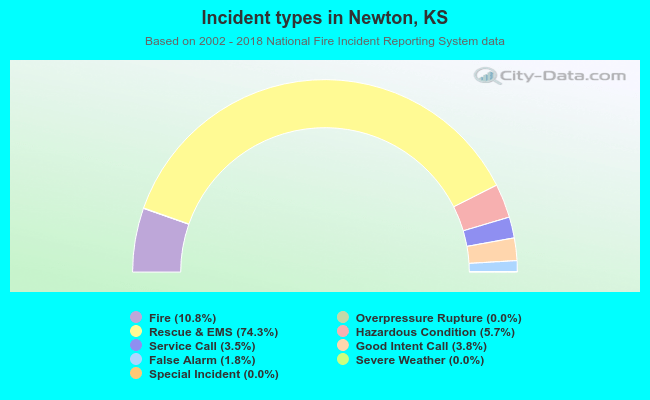 Out of all 14,862 cases reported during the years 2002 - 2018, the most belonged to the categories: Rescue & EMS (74.3%), Fire (10.8%), and Hazardous Condition (5.7%).
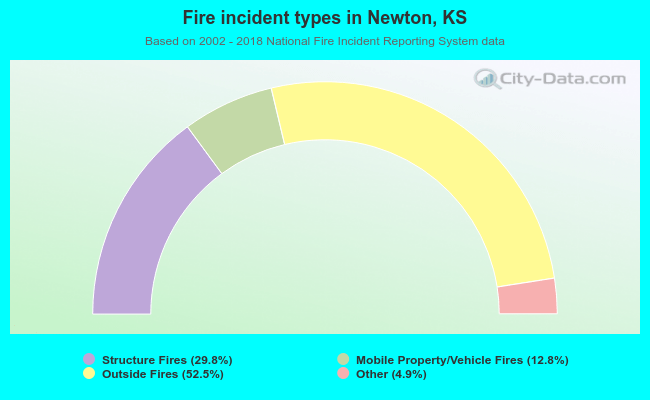 When looking into fire subcategories, the most reports belonged to: Outside Fires (52.5%), and Structure Fires (29.8%).