Harrisville: Fire Incidents, Utah (UT)
Where are fire incidents reported in Harrisville, UT
Something went wrong! Please refresh the page.
|
| |||||||||||||||||||||||||||||||||||||||||||||||||||||||||||||||||||||||||||||||||||||||||||||||||||||||||||||
2002 - 2018 National Fire Incident Reporting System (NFIRS) incidents
- Incident types reported to NFIRS in Harrisville, UT
- 1,73160.3%Rescue & EMS
- 52318.2%Good Intent Call
- 2267.9%Fire
- 1956.8%Hazardous Condition
- 983.4%False Alarm
- 893.1%Service Call
- 40.1%Special Incident
- Fire incident types reported to NFIRS in Harrisville, UT
- 9441.6%Structure Fires
- 8838.9%Outside Fires
- 3515.5%Mobile Property/Vehicle Fires
- 94.0%Other
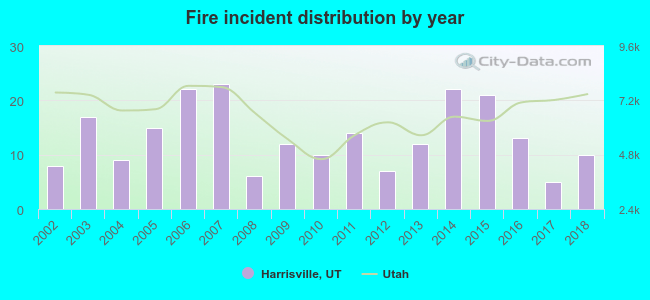 According to the data from the years 2002 - 2018 the average number of fire incidents per year is 13. The highest number of reported fires - 23 took place in 2007, and the least - 5 in 2017. The data has a growing trend.
The average number of yearly fire incidents per 10k residents in Harrisville, UT compared to nearest cities:
(Note: Based on data for the last 3 years, including only cities with population 5,000 and above)
| Harrisville: | 15.4 |
| Farr West: | 34.2 |
| North Ogden: | 12.1 |
| Pleasant View: | 26.4 |
| Ogden: | 35.9 |
| Plain City: | 15.6 |
| West Haven: | 40.6 |
| Riverdale: | 33.0 |
| South Ogden: | 21.4 |
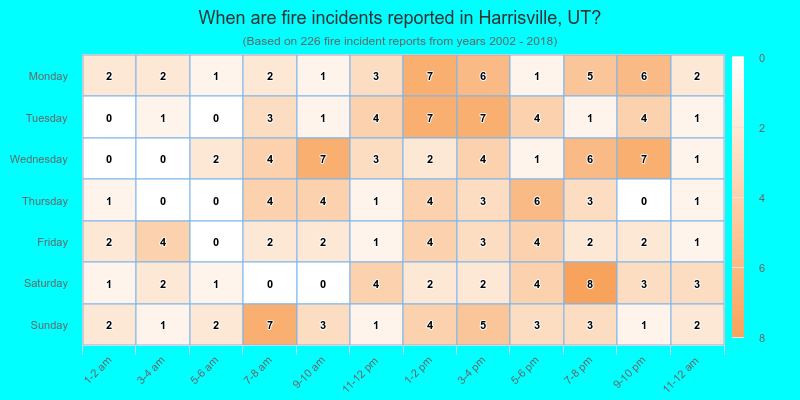
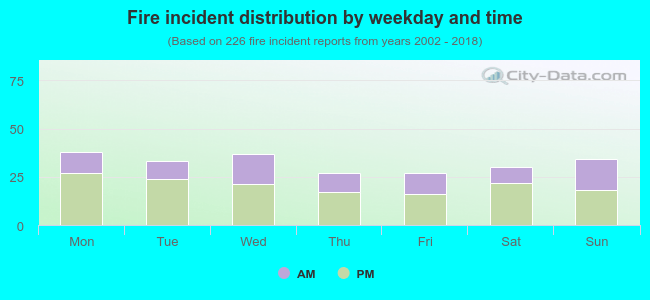 35.8% incidents where reported in the morning and 64.2% in the evening. The most fires (16.8%) took place on Monday, and the least (11.9%) on Thursday.
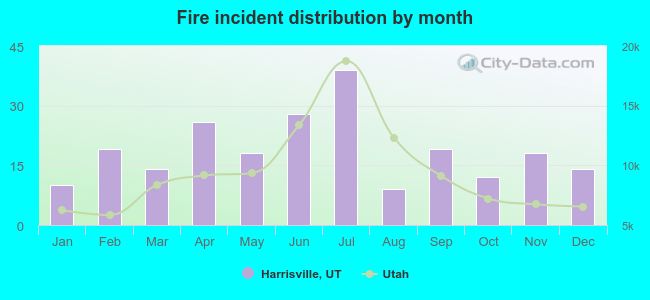 According to the 226 fire incidents from years 2002 - 2018 most fires (17.3%) took place during July, and the least (4.0%) in August.
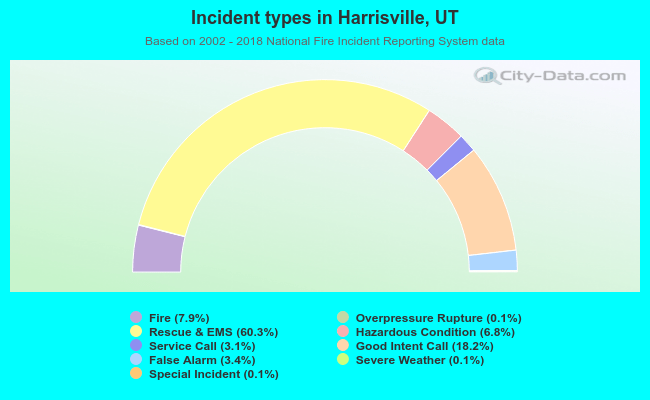 Out of all 2,870 cases reported during the years 2002 - 2018, the most belonged to the categories: Rescue & EMS (60.3%), Good Intent Call (18.2%), and Fire (7.9%).
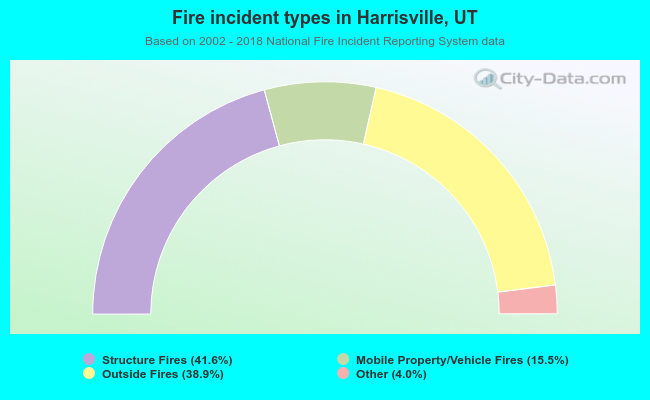 When looking into fire subcategories, the most incidents belonged to: Structure Fires (41.6%), and Outside Fires (38.9%).