Pleasant View: Fire Incidents, Utah (UT)
Where are fire incidents reported in Pleasant View, UT
Something went wrong! Please refresh the page.
|
| |||||||||||||||||||||||||||||||||||||||||||||||||||||||||||||||||||||||||||||||||||||||||||||||||||||||||||||
2002 - 2018 National Fire Incident Reporting System (NFIRS) incidents
- Incident types reported to NFIRS in Pleasant View, UT
- 2,12056.5%Rescue & EMS
- 73719.6%Good Intent Call
- 3238.6%Fire
- 2376.3%Hazardous Condition
- 1794.8%Service Call
- 1463.9%False Alarm
- 40.1%Special Incident
- Fire incident types reported to NFIRS in Pleasant View, UT
- 16852.0%Outside Fires
- 10532.5%Structure Fires
- 329.9%Mobile Property/Vehicle Fires
- 185.6%Other
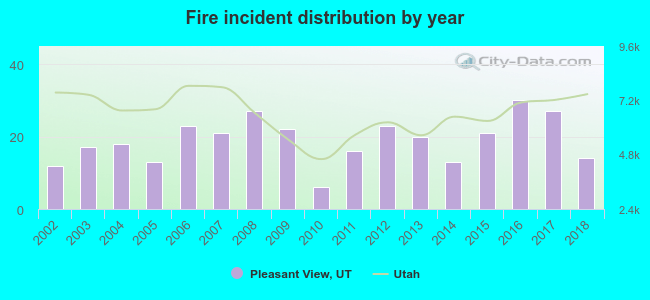 Based on the data from the years 2002 - 2018 the average number of fires per year is 19. The highest number of fires - 30 took place in 2016, and the least - 6 in 2010. The data has a growing trend.
The average number of yearly fire incidents per 10k residents in Pleasant View, UT compared to nearest cities:
(Note: Based on data for the last 3 years, including only cities with population 5,000 and above)
| Pleasant View: | 26.4 |
| North Ogden: | 12.1 |
| Farr West: | 34.2 |
| Harrisville: | 15.4 |
| Plain City: | 15.6 |
| Ogden: | 35.9 |
| West Haven: | 40.6 |
| Riverdale: | 33.0 |
| South Ogden: | 21.4 |
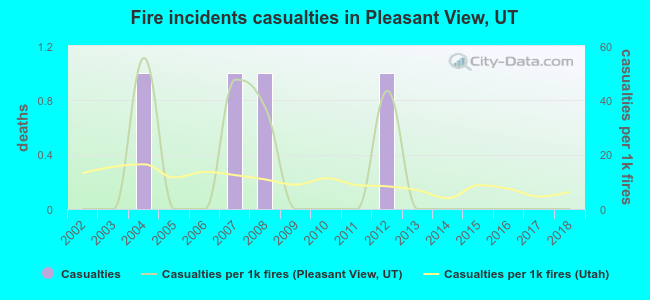 According to the data from the years 2002 - 2018 the average number of fire-related yearly casualties is 0. The highest number of reported casualties - 1 took place in 2004, and the lowest - 0 in 2002. The data has a constant trend.
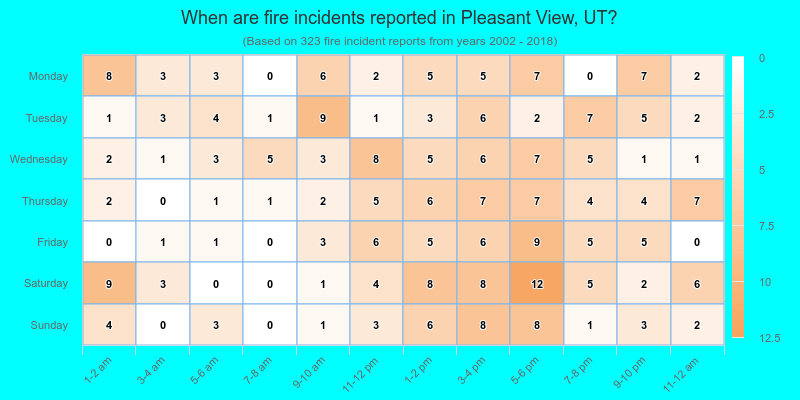
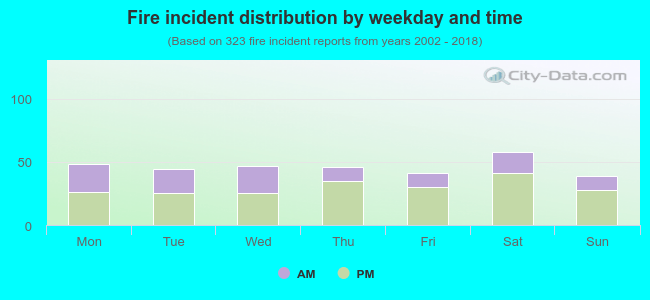 35.0% incidents where reported in the morning and 65.0% in the evening. The most fires (18.0%) took place on Saturday, and the least (12.1%) on Sunday.
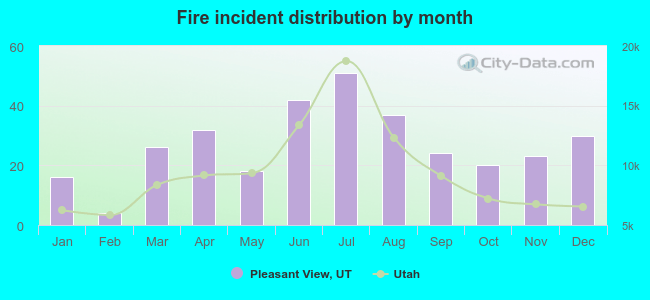 Based on the 323 fires from years 2002 - 2018 most fires (15.8%) took place during July, and the least (1.2%) in February.
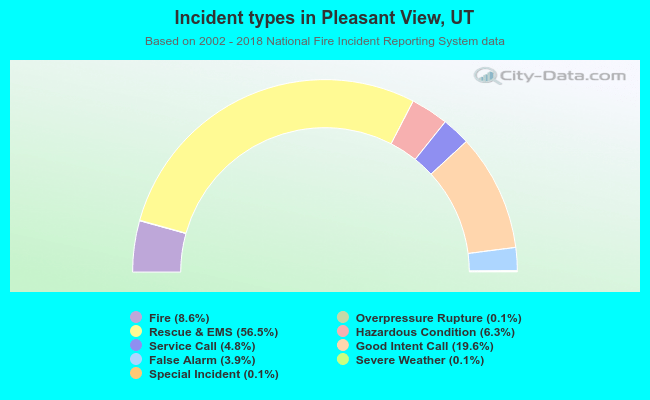 Out of all 3,752 cases reported during the years 2002 - 2018, the most belonged to the categories: Rescue & EMS (56.5%), Good Intent Call (19.6%), and Fire (8.6%).
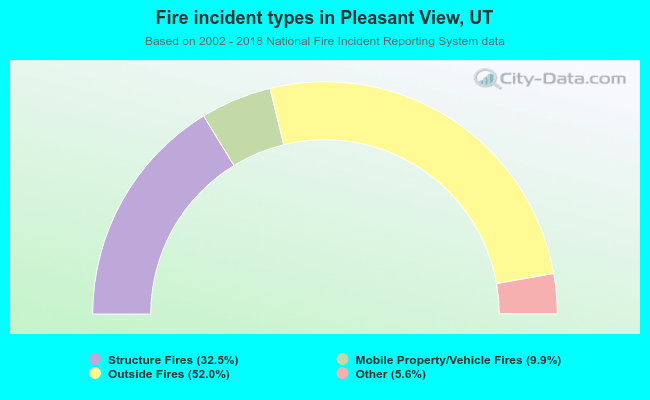 When looking into fire subcategories, the most reports belonged to: Outside Fires (52.0%), and Structure Fires (32.5%).